Ikshana, The backbone of your factory.
From data collection to advanced analytics, our modules cover it all. Connect your PLCs in minutes and get sub-second visibility into every machine and its parameters.
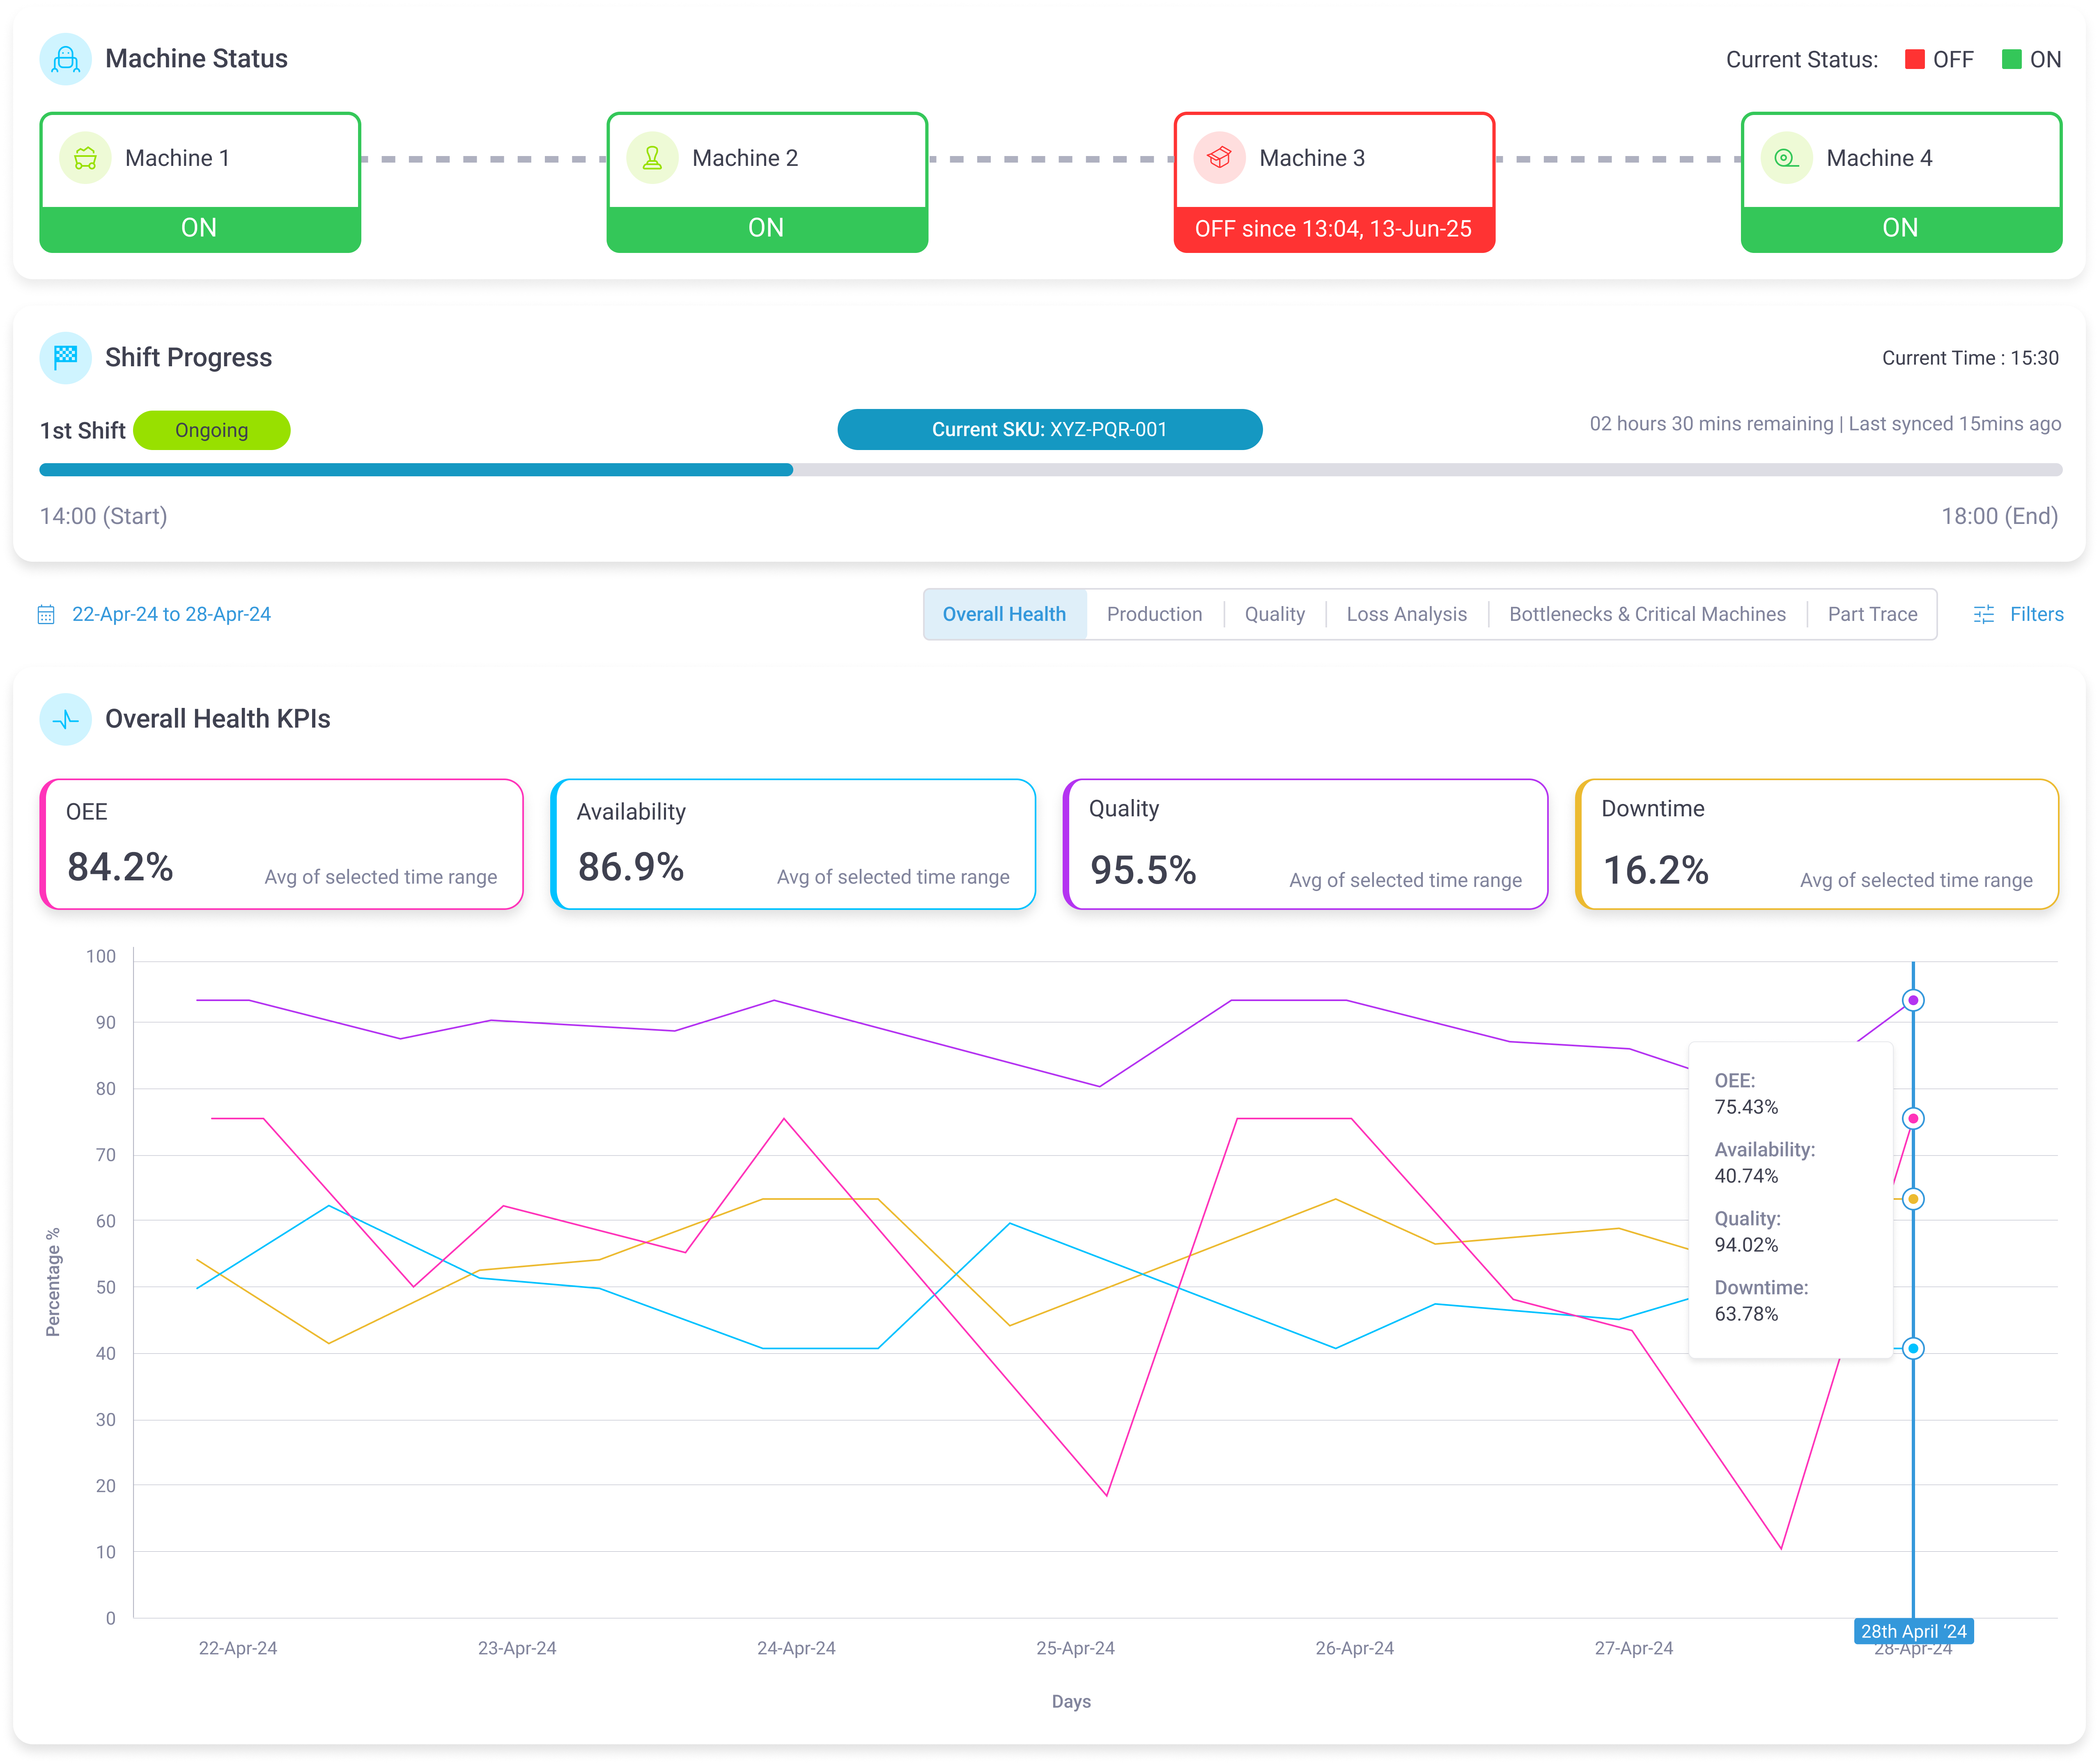
From data collection to advanced analytics, our modules cover it all. Connect your PLCs in minutes and get sub-second visibility into every machine and its parameters.
Explore the 8 core modules that power the Ikshana intelligence engine.

View your line metrics and KPIs in a single glance. Customize views for operators, plant managers, and executives so everyone sees the data that matters most to their targets.
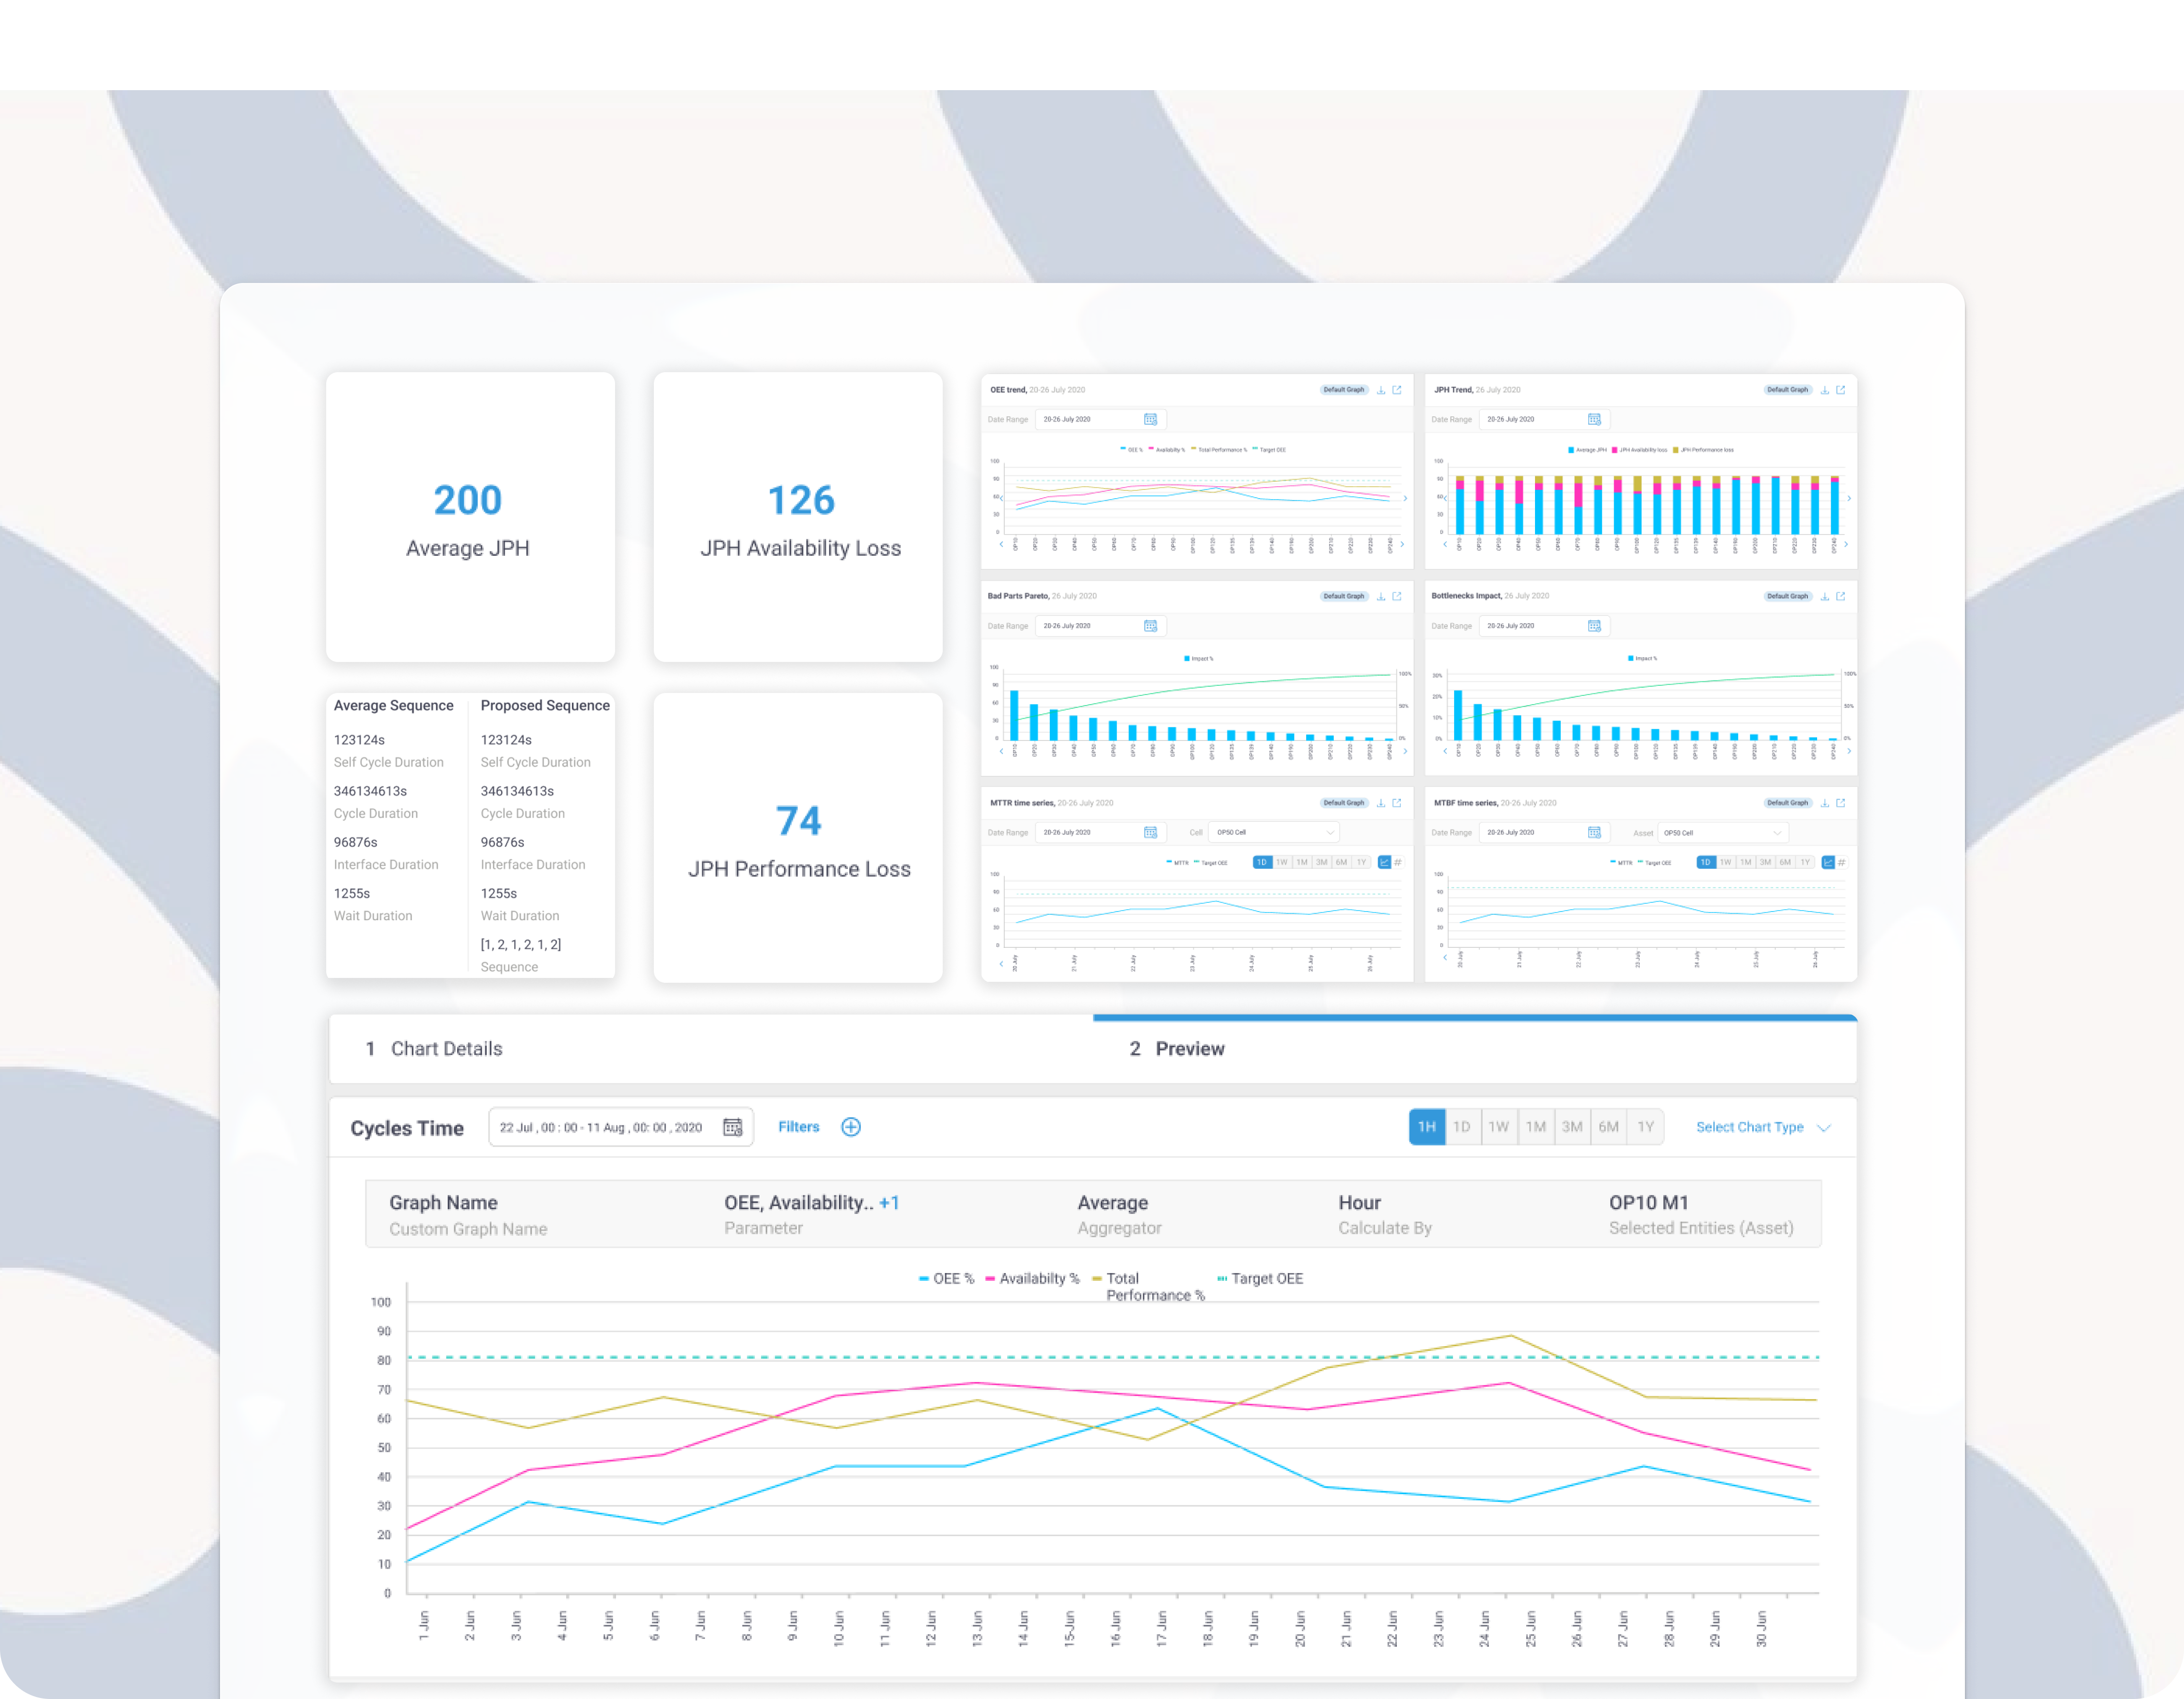

Go beyond basic up/down status. Monitor key physical parameters—like temperature, pressure, and clamp times—for all cells on your line polled at sub-second intervals.
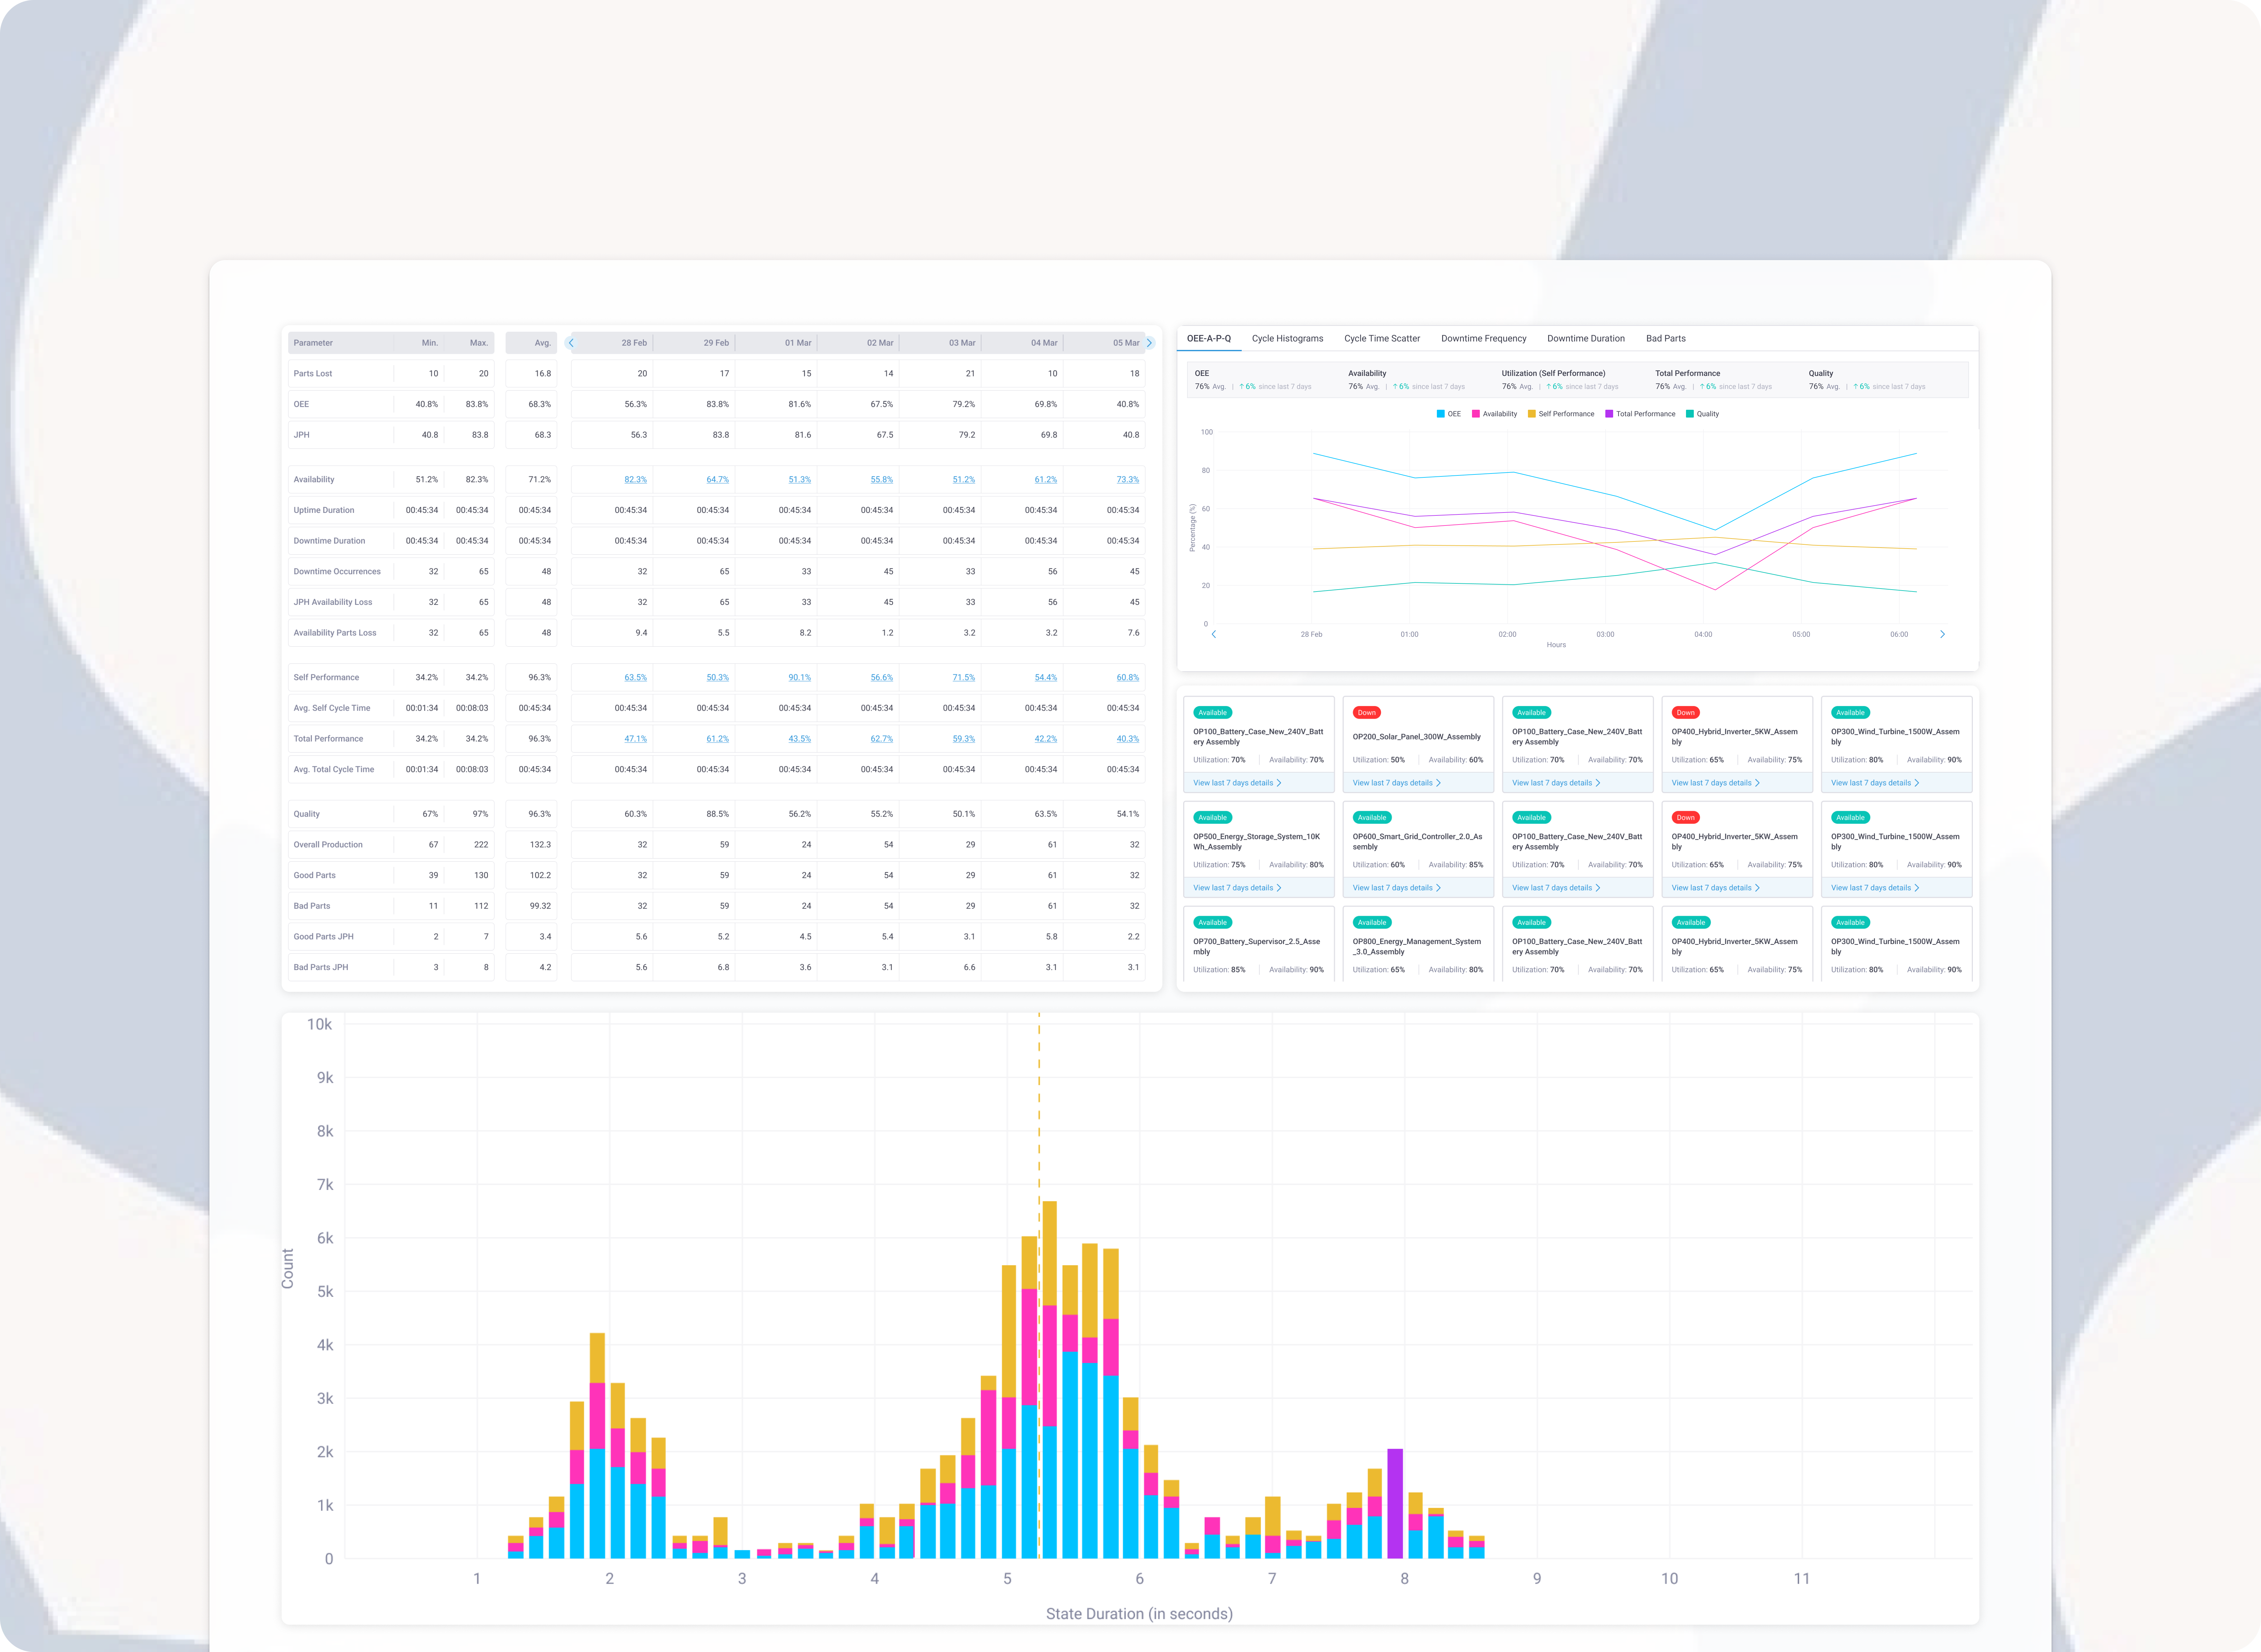

Ensure your line is meeting targets and monitor shift-level production pacing in real-time. Compare output across shifts, days, and historical benchmarks.
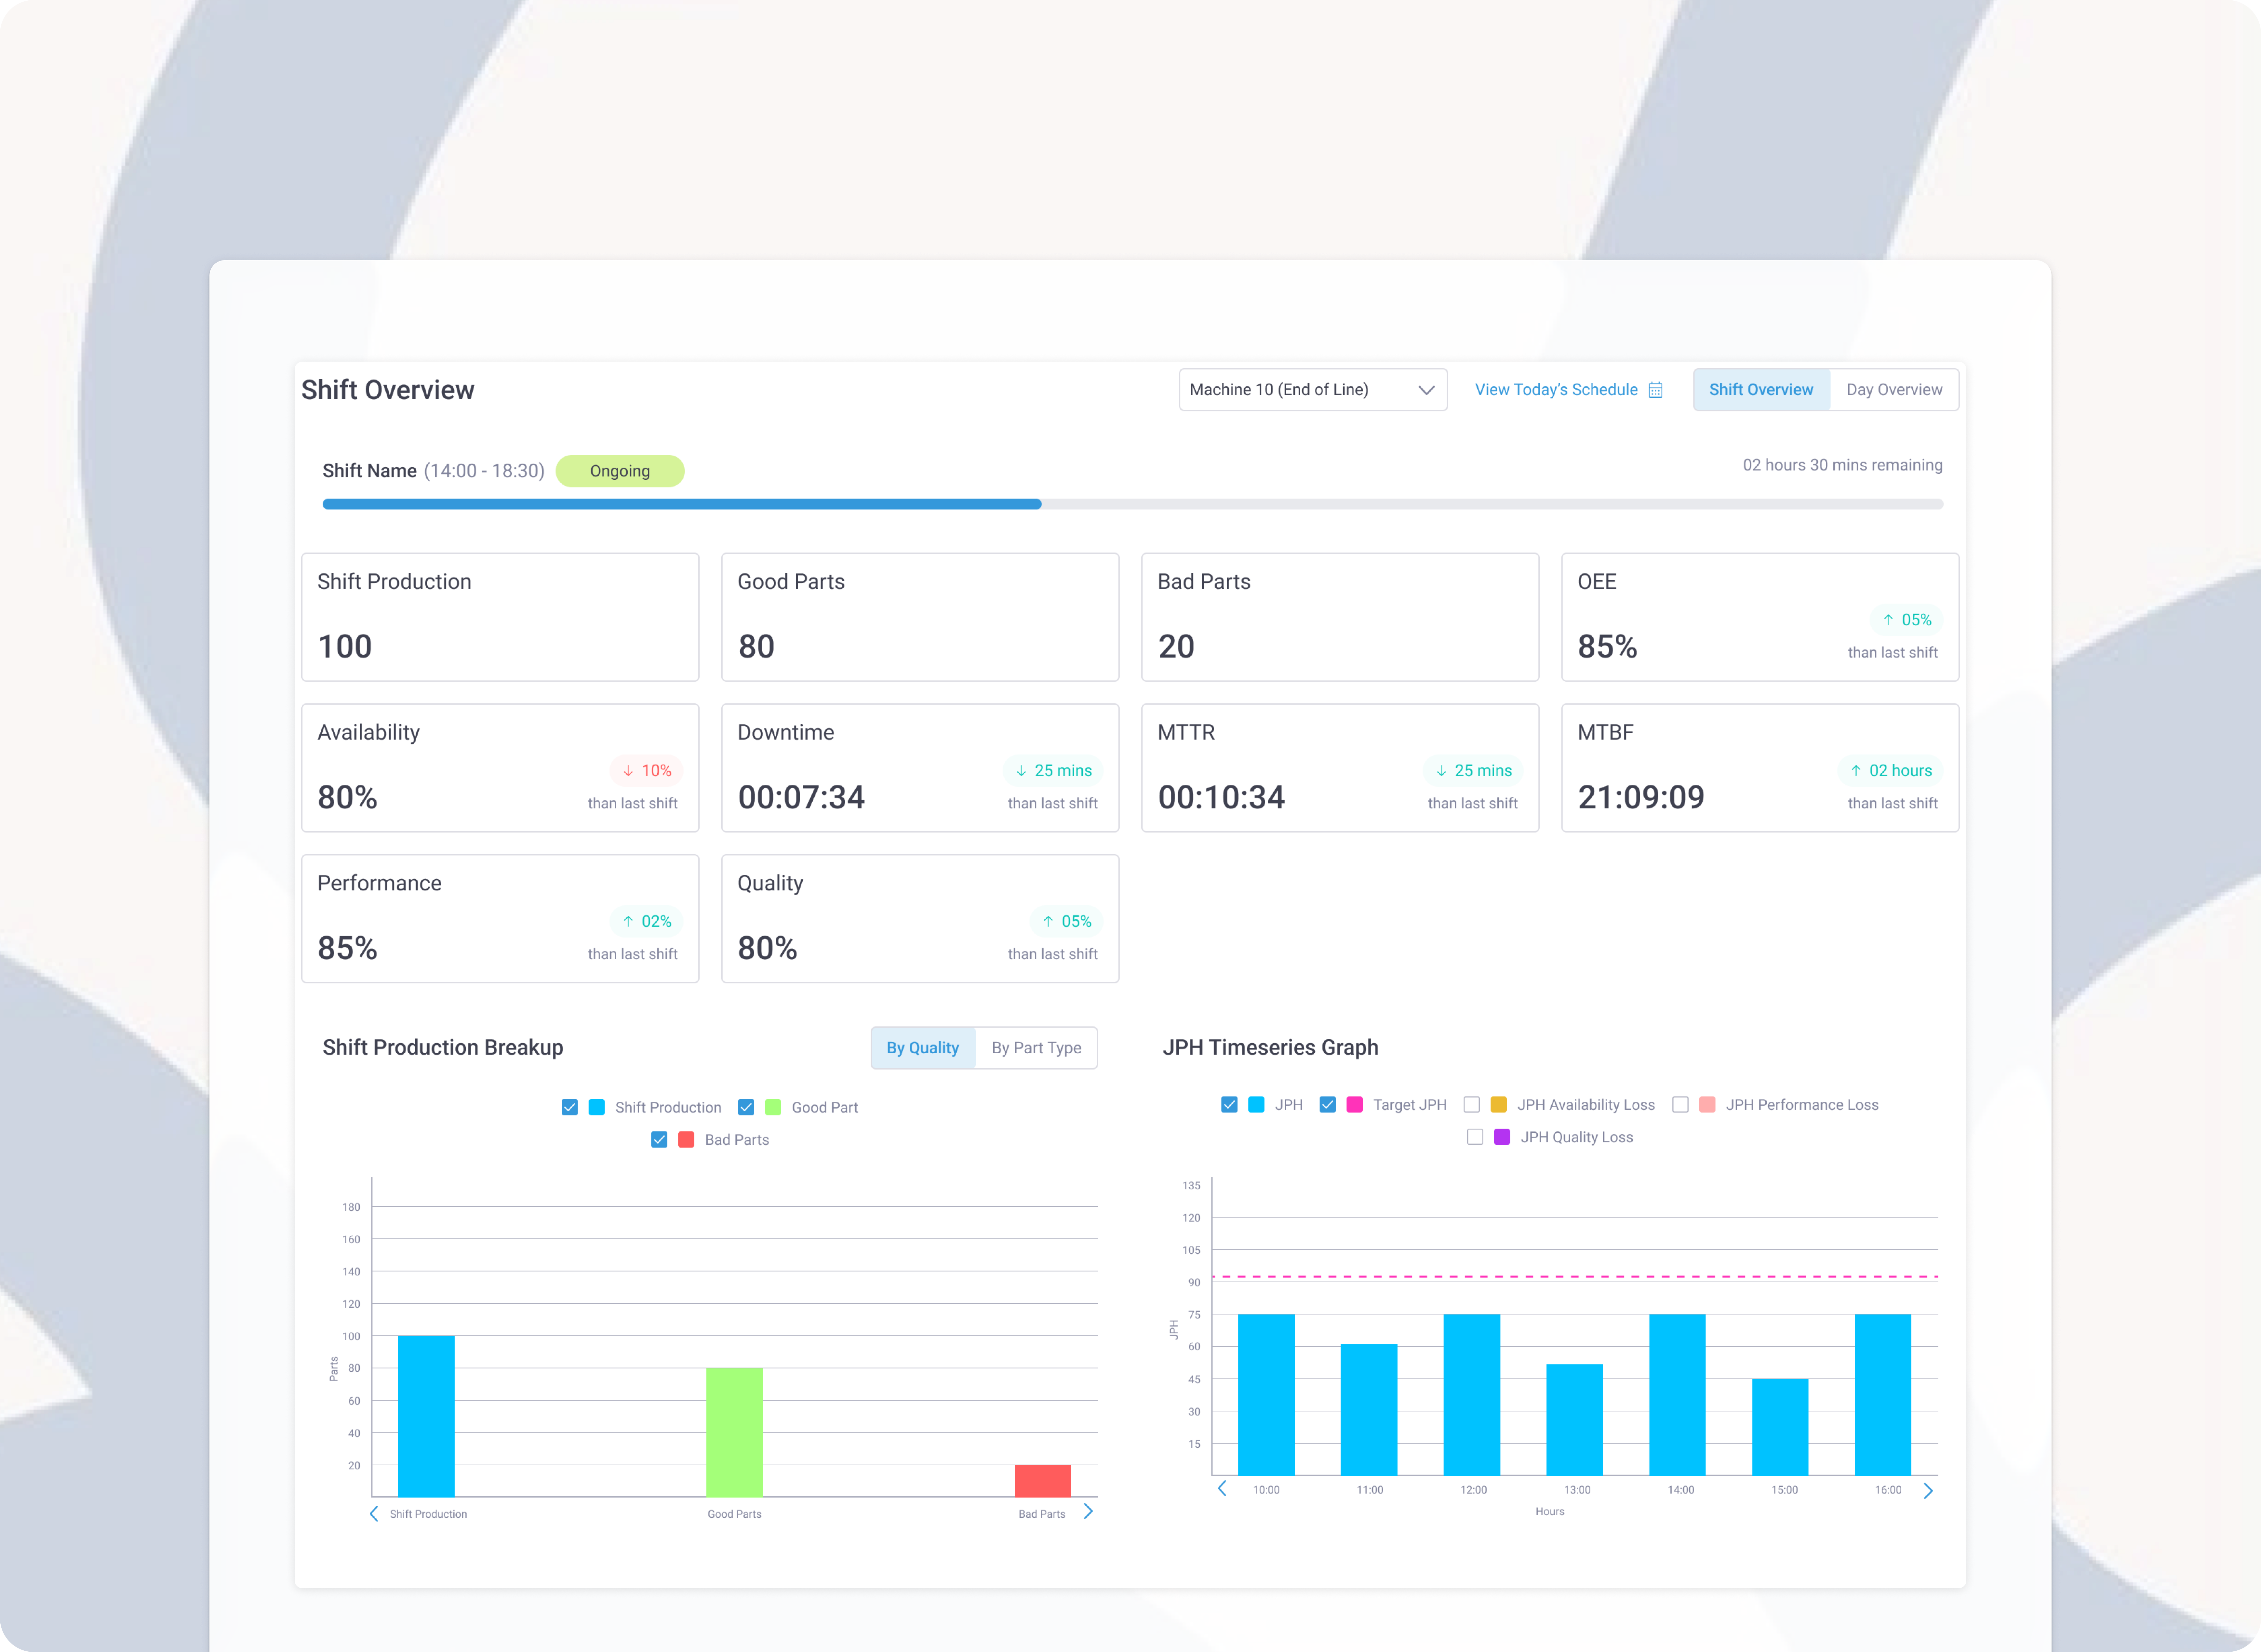
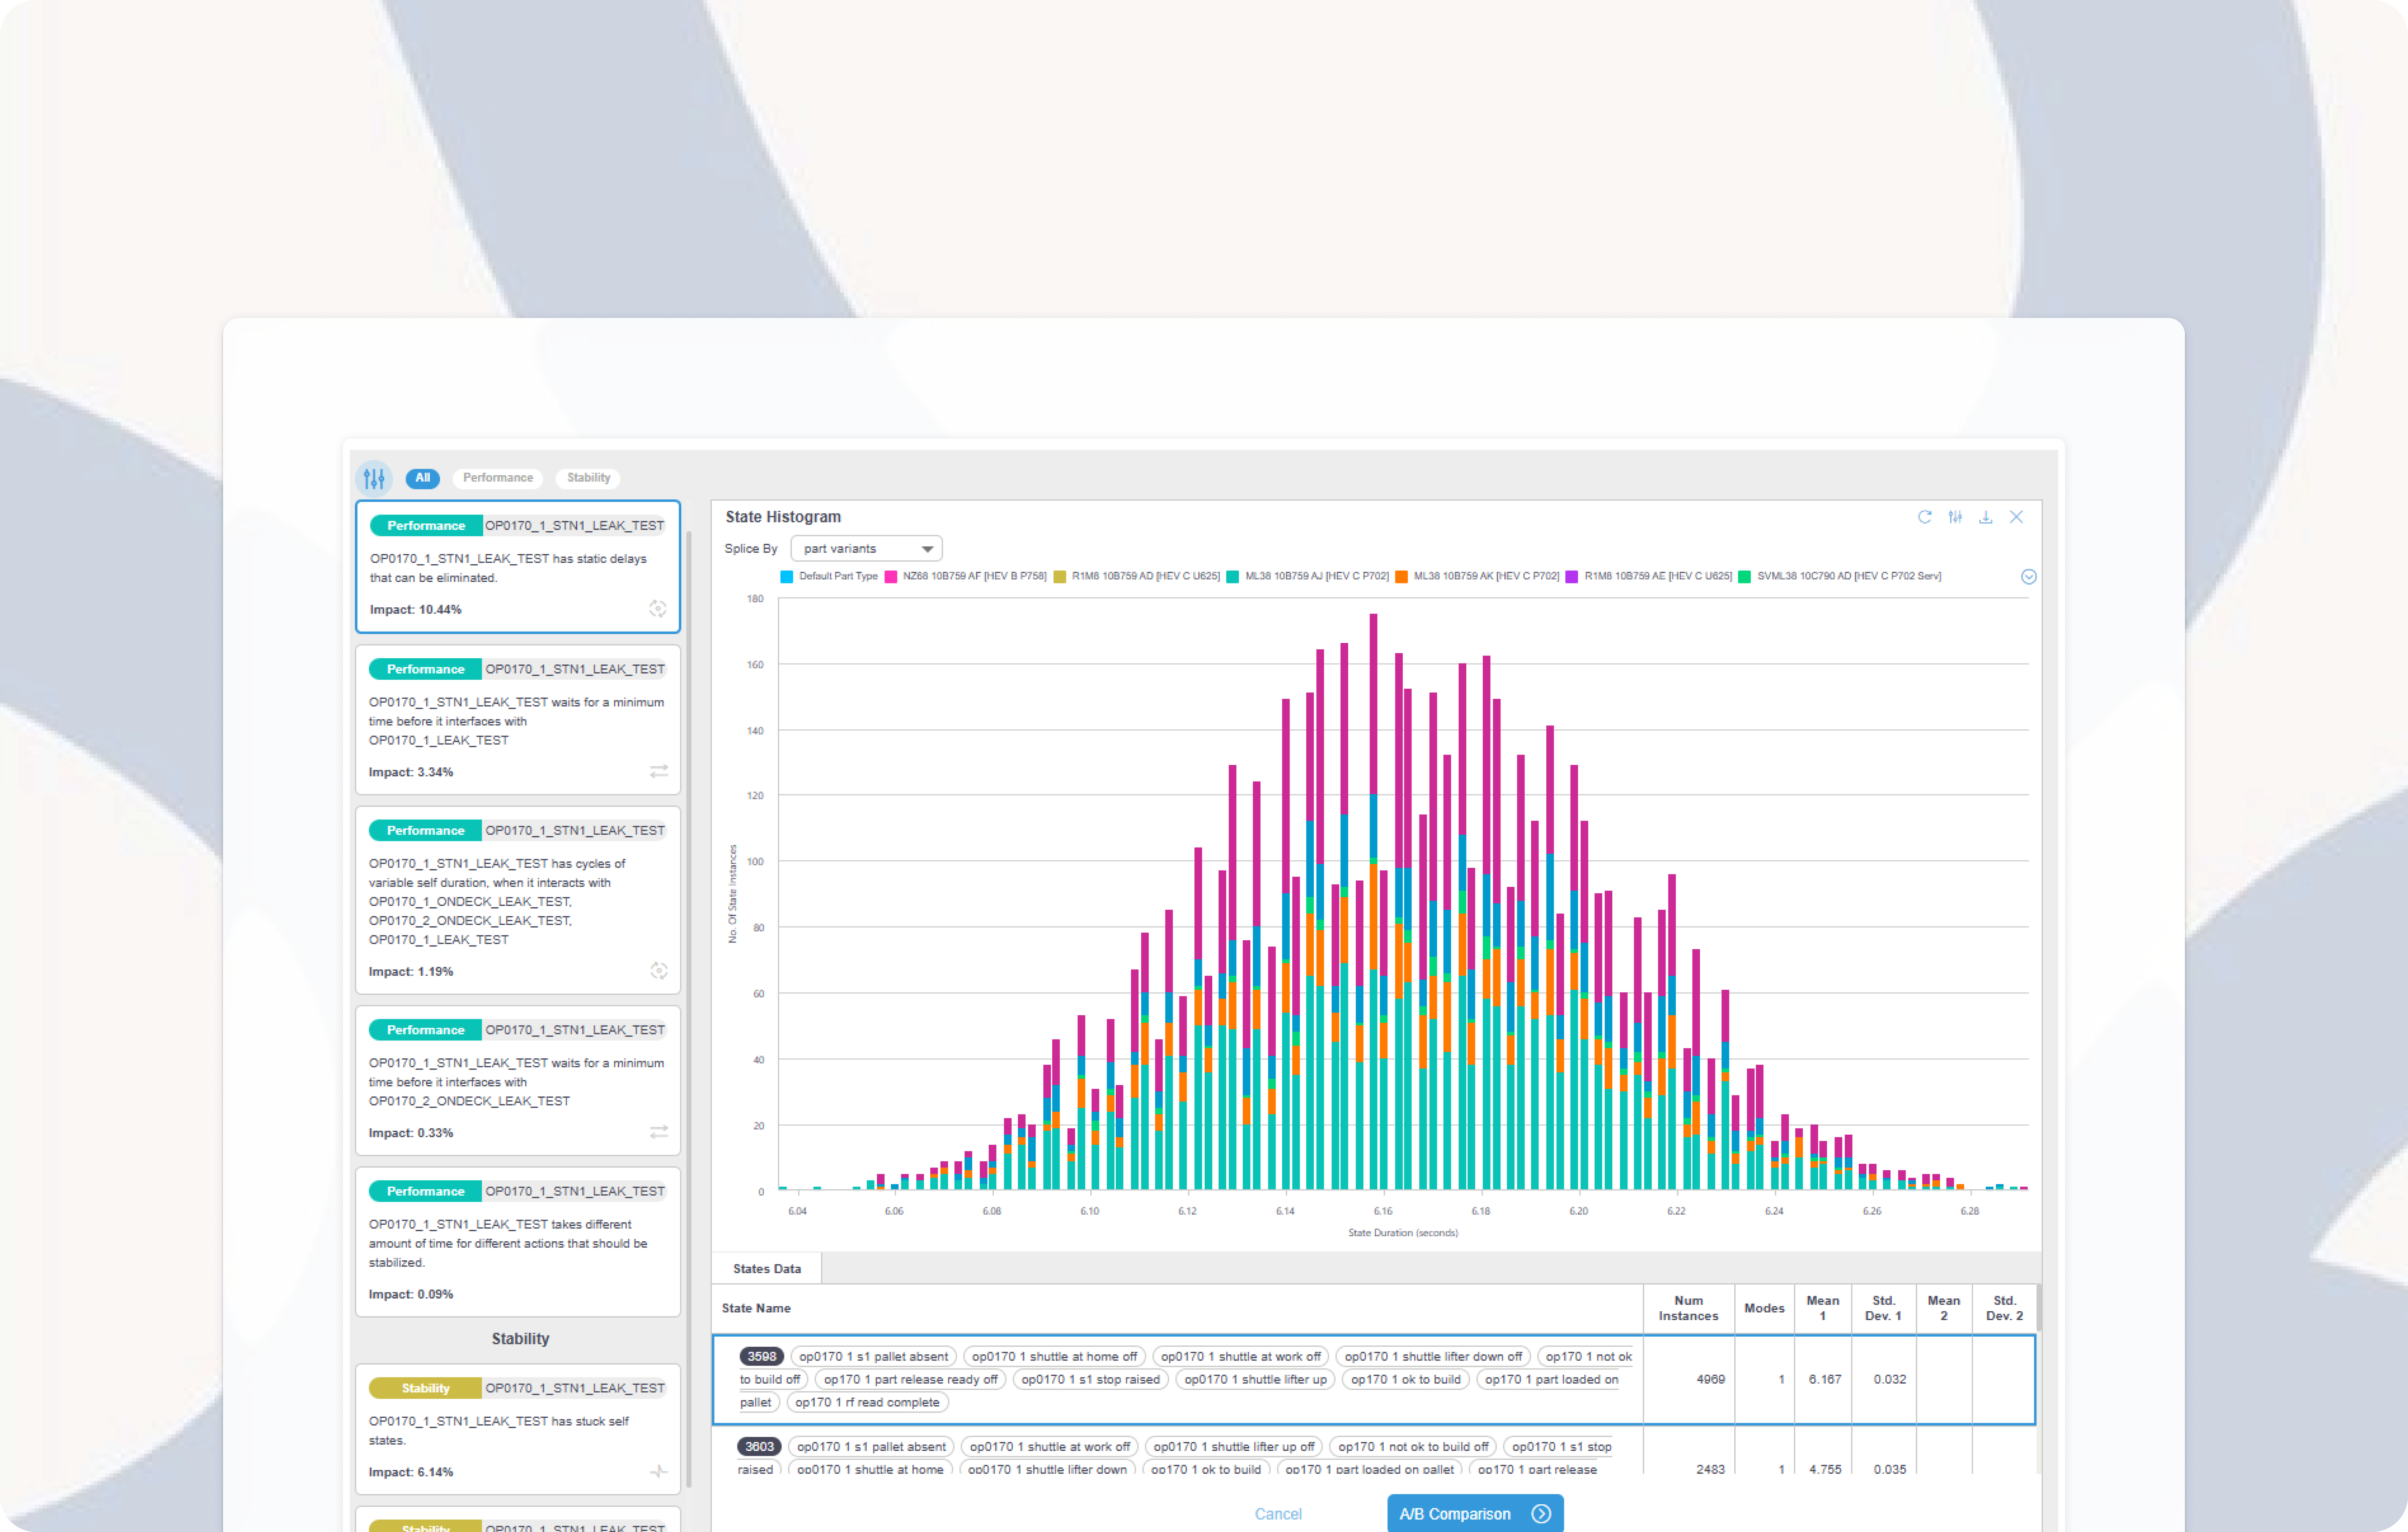
Automatically analyze which machines are the true constraints on your line. Stop wasting CapEx optimizing the wrong stations by letting Ikshana's algorithm identify the flow restrictors.

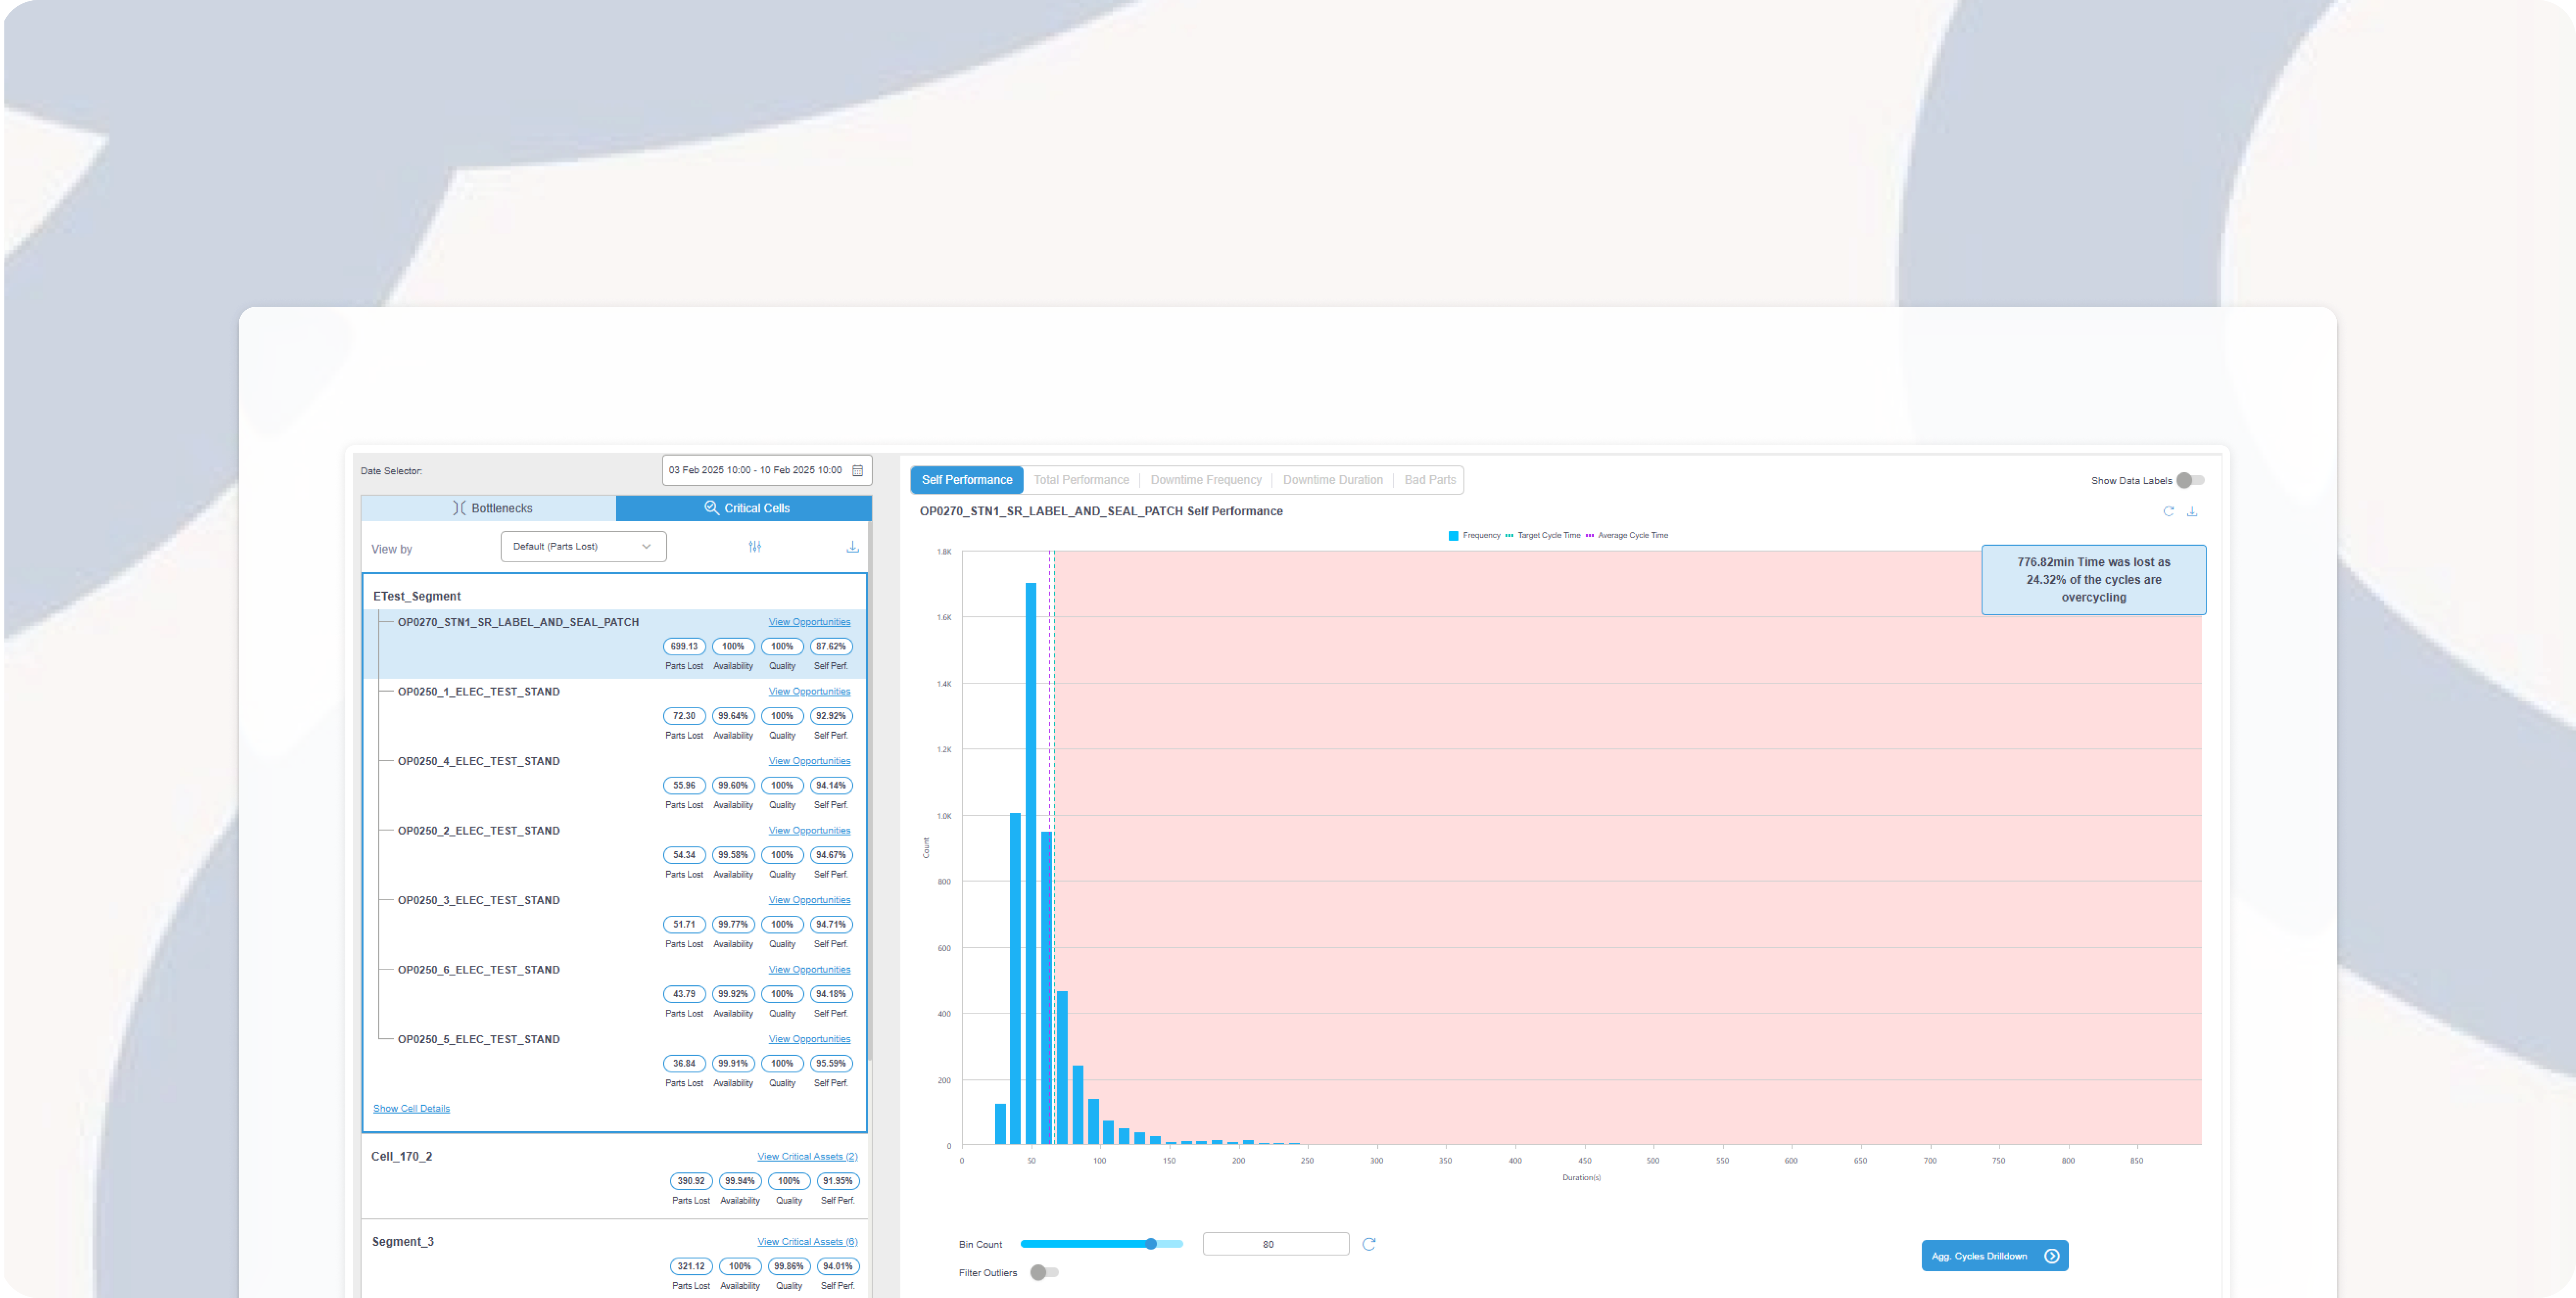
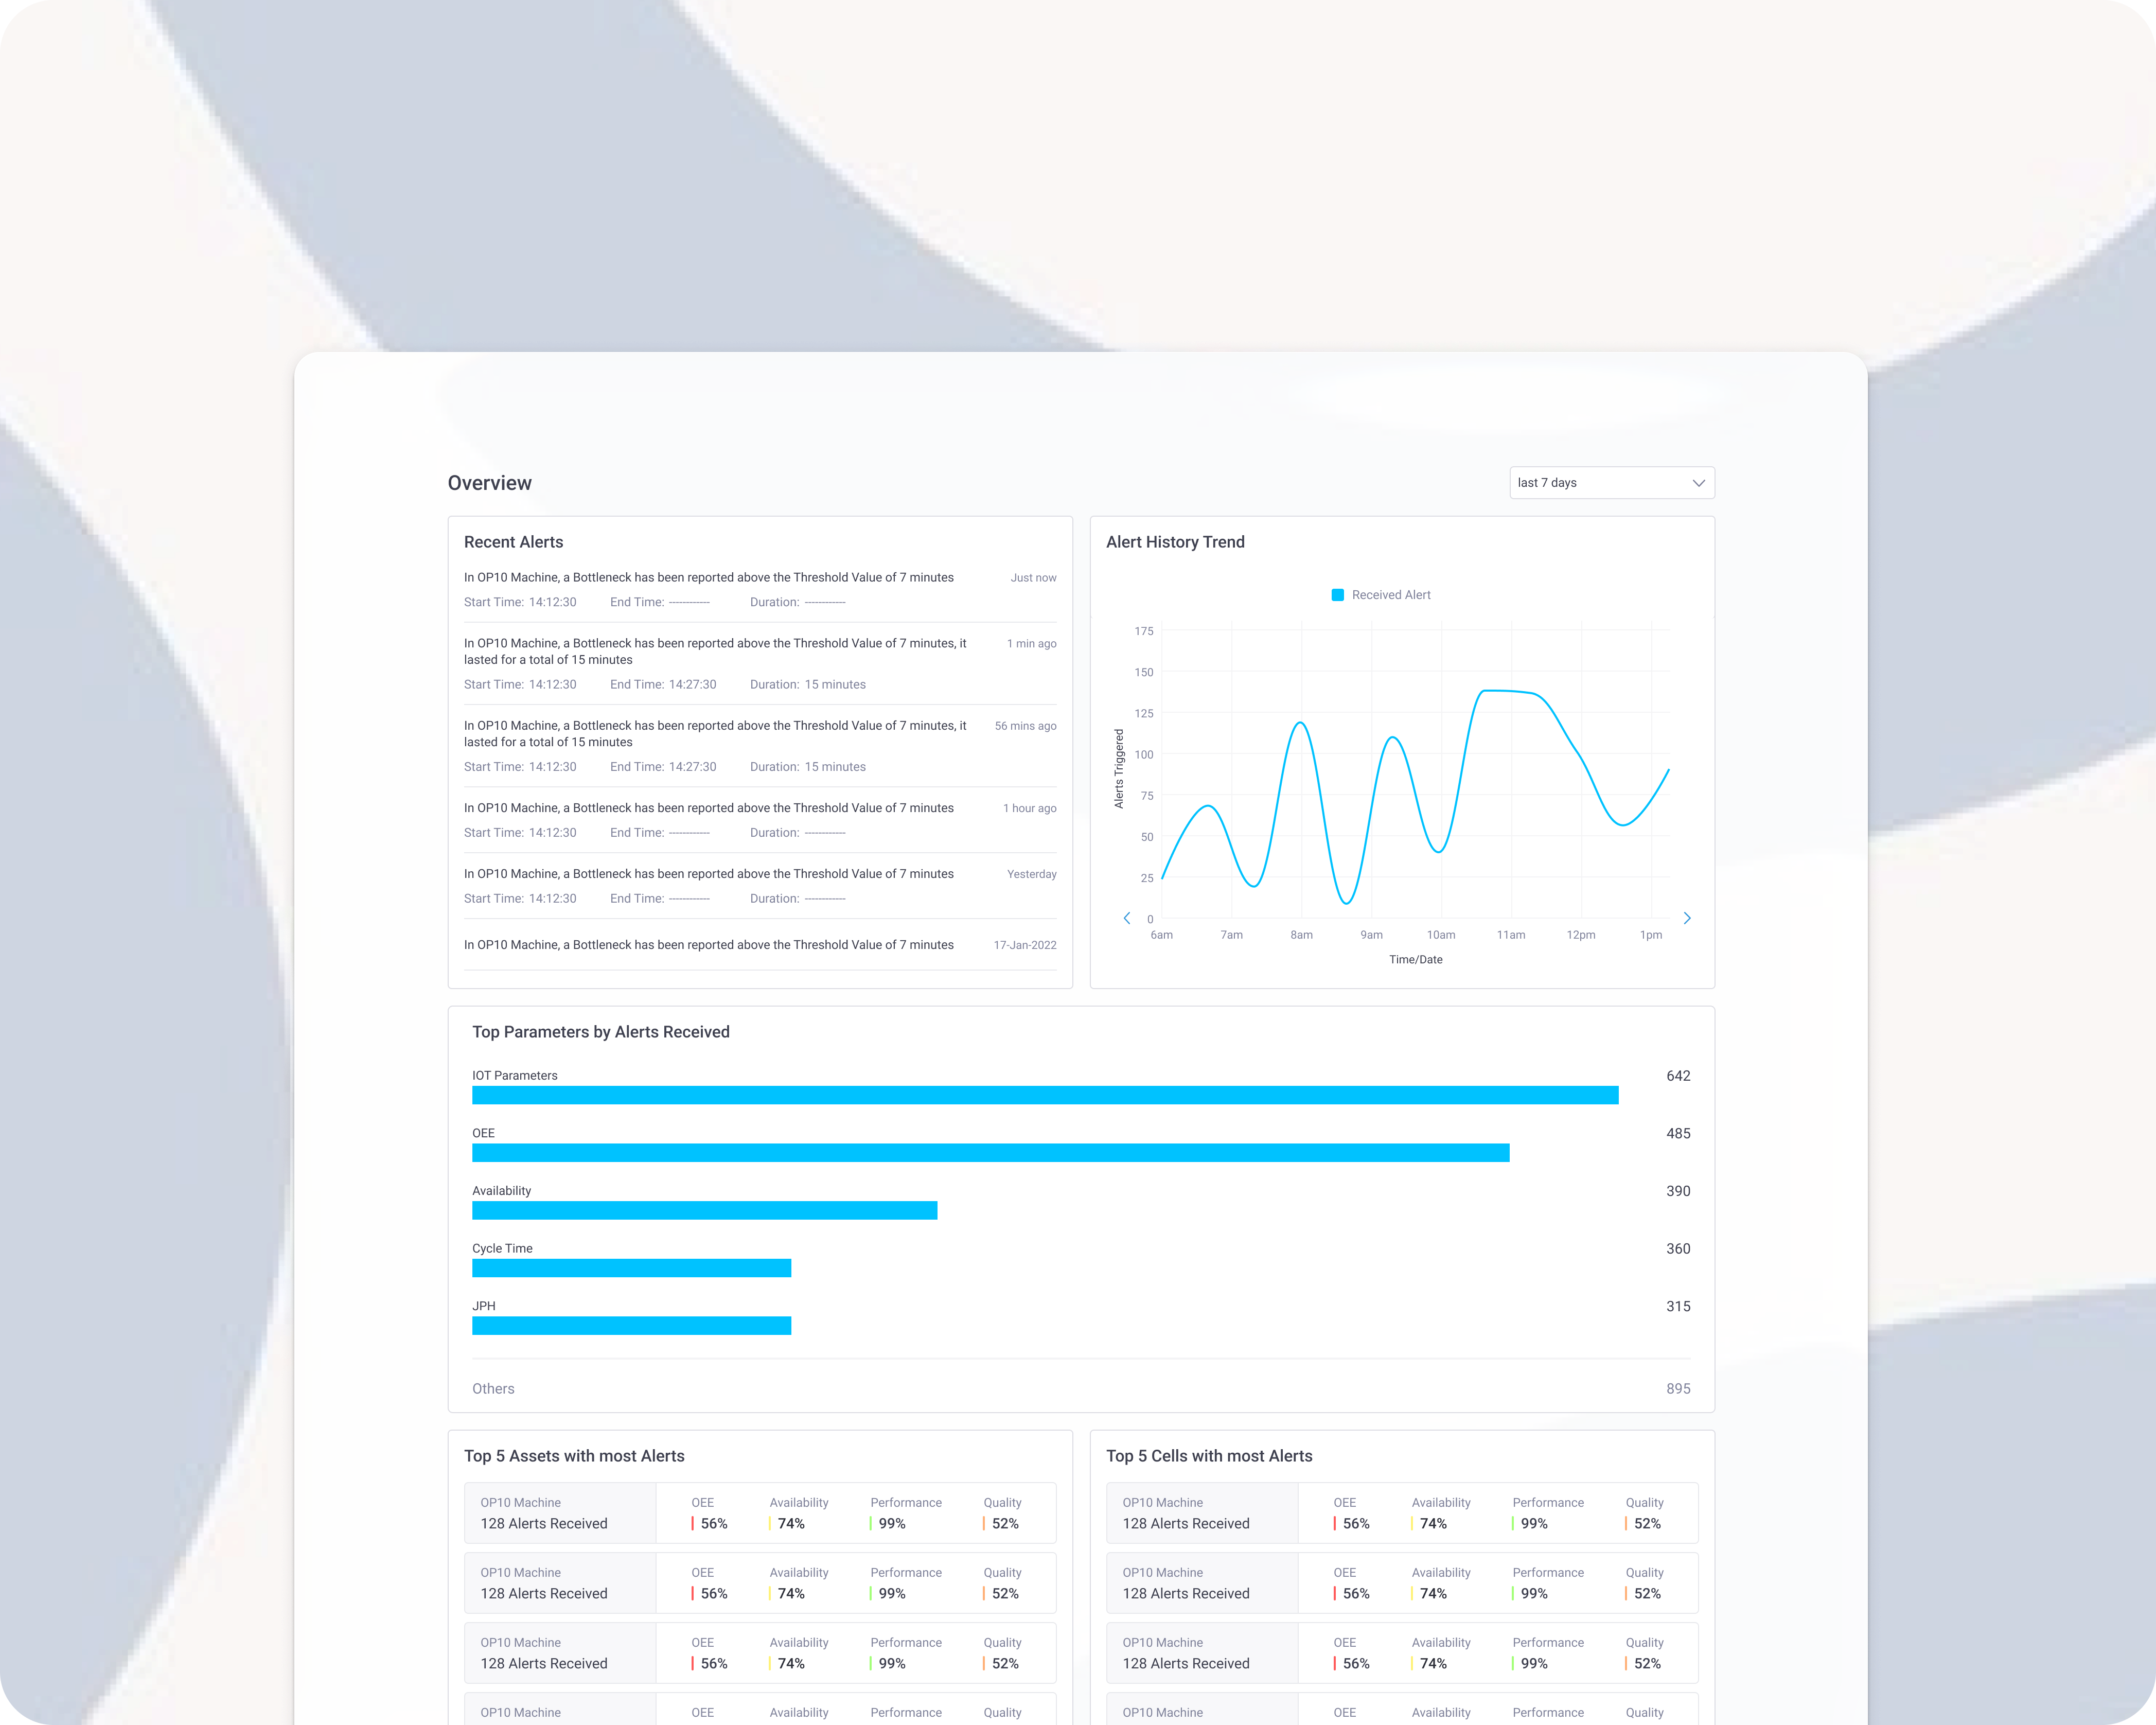
Drill down into specific assets that require elevated monitoring based on historical criticality parameters. Set up SMS and email alerts for specific micro-fault conditions.

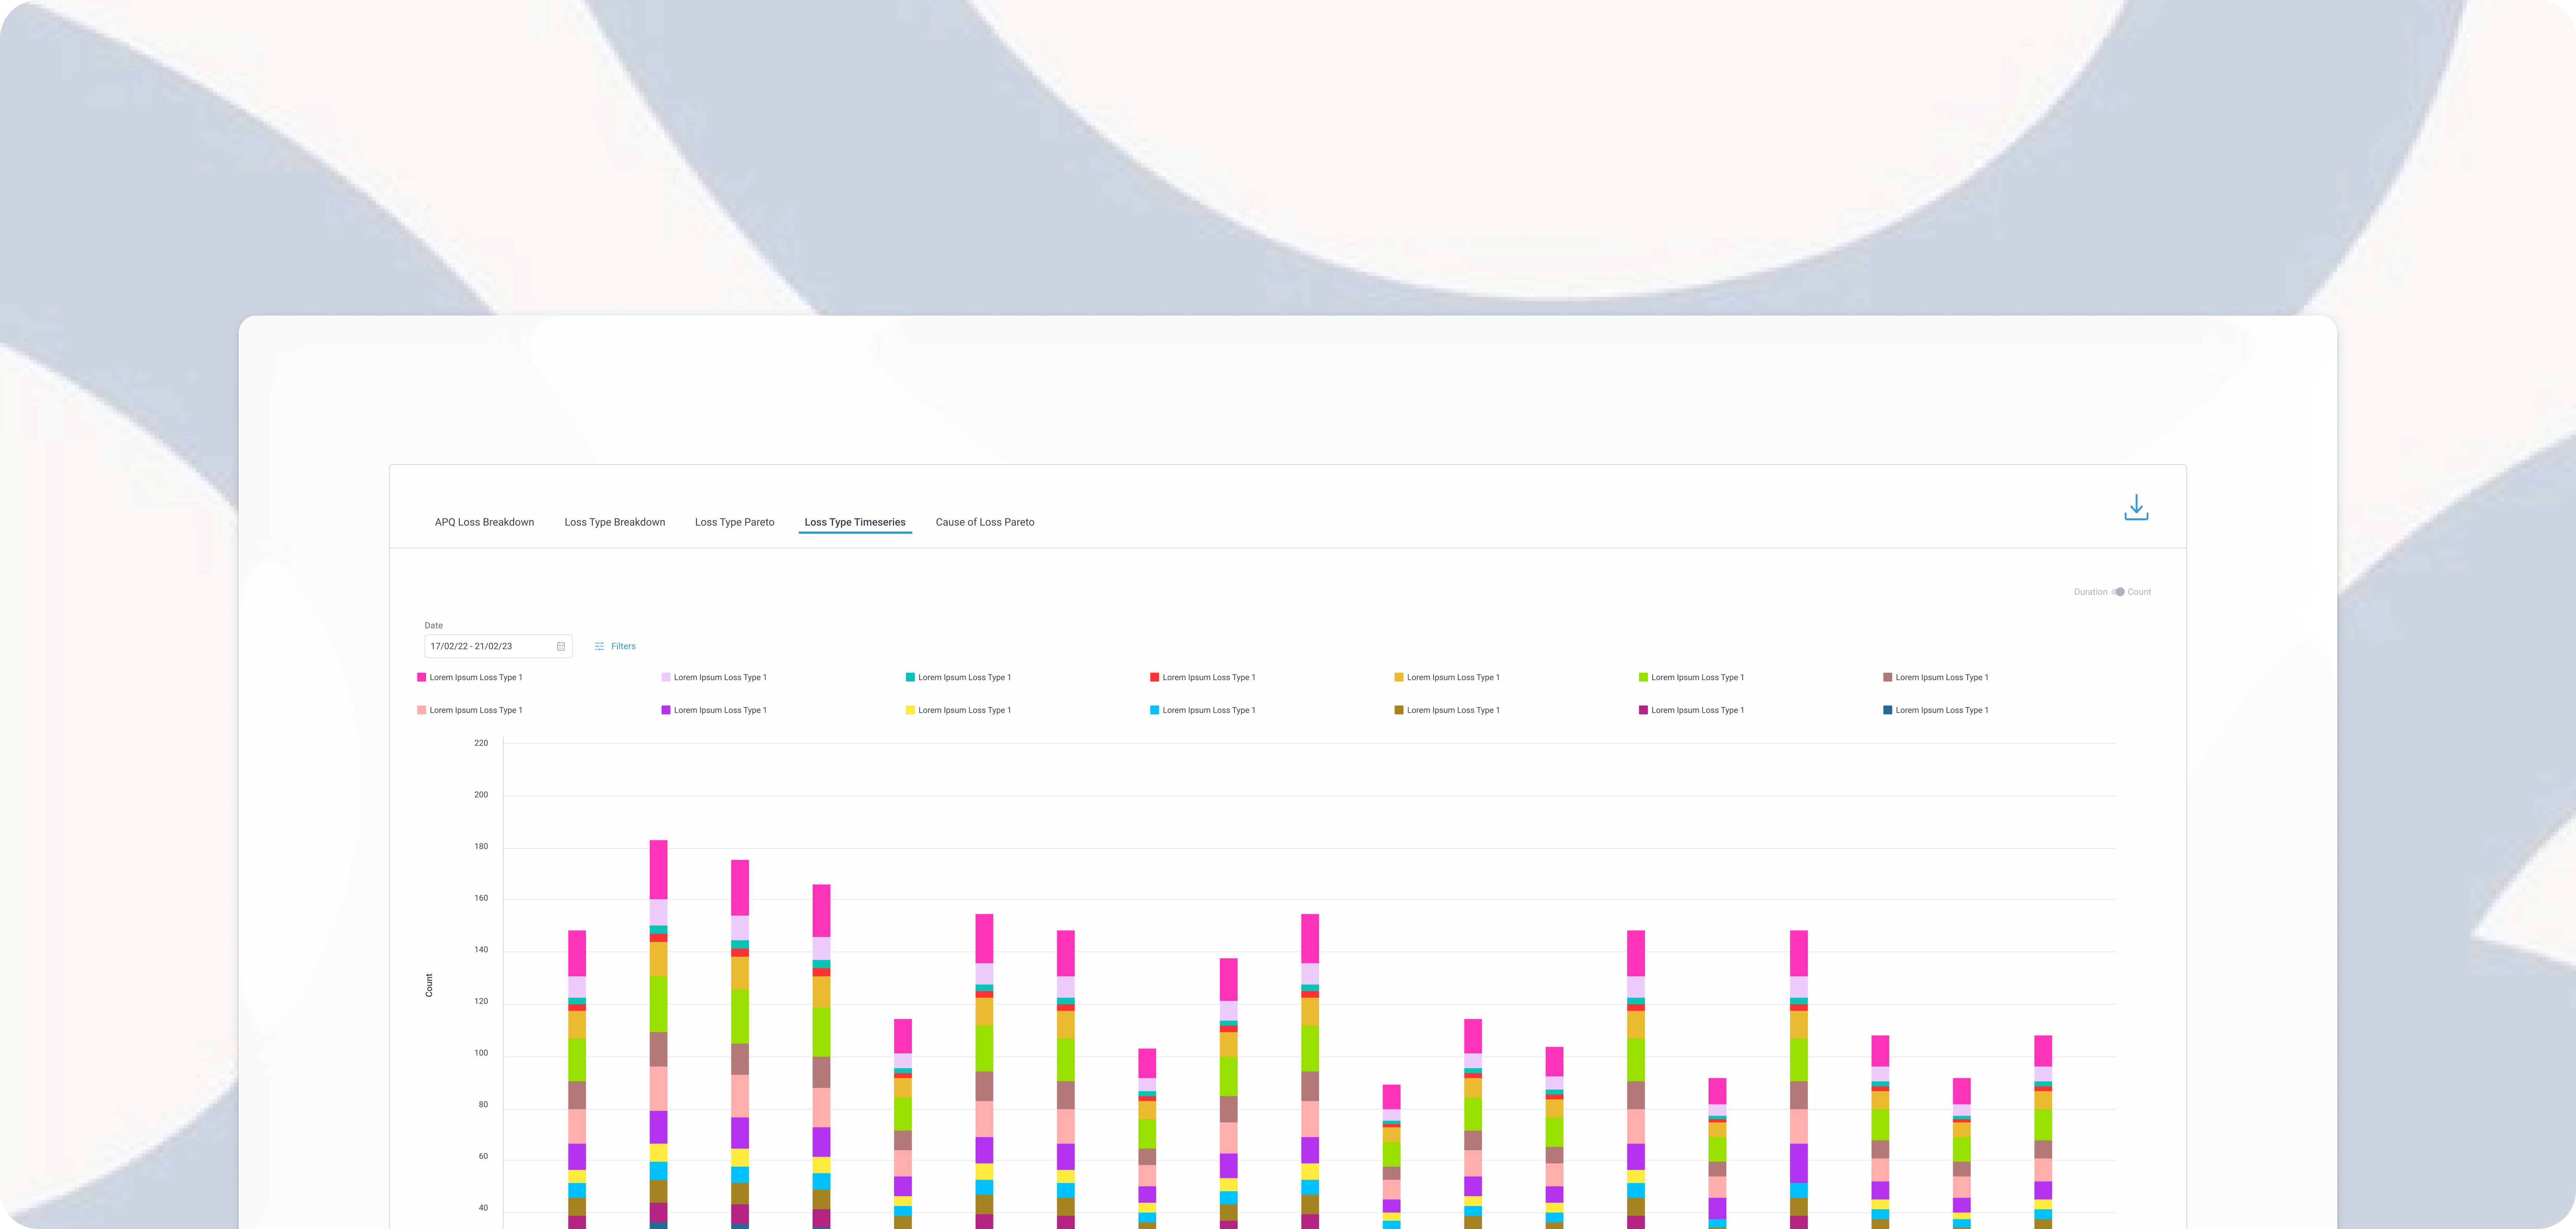
Stop guessing why you missed shift targets. Ikshana automatically captures and categorizes every micro-stoppage, allowing you to analyze each loss instance and its root cause instantly.

Trace the exact lifecycle of a specific part throughout the entire production line. Track all associated quality parameters and environmental conditions at the exact moment the part was processed.
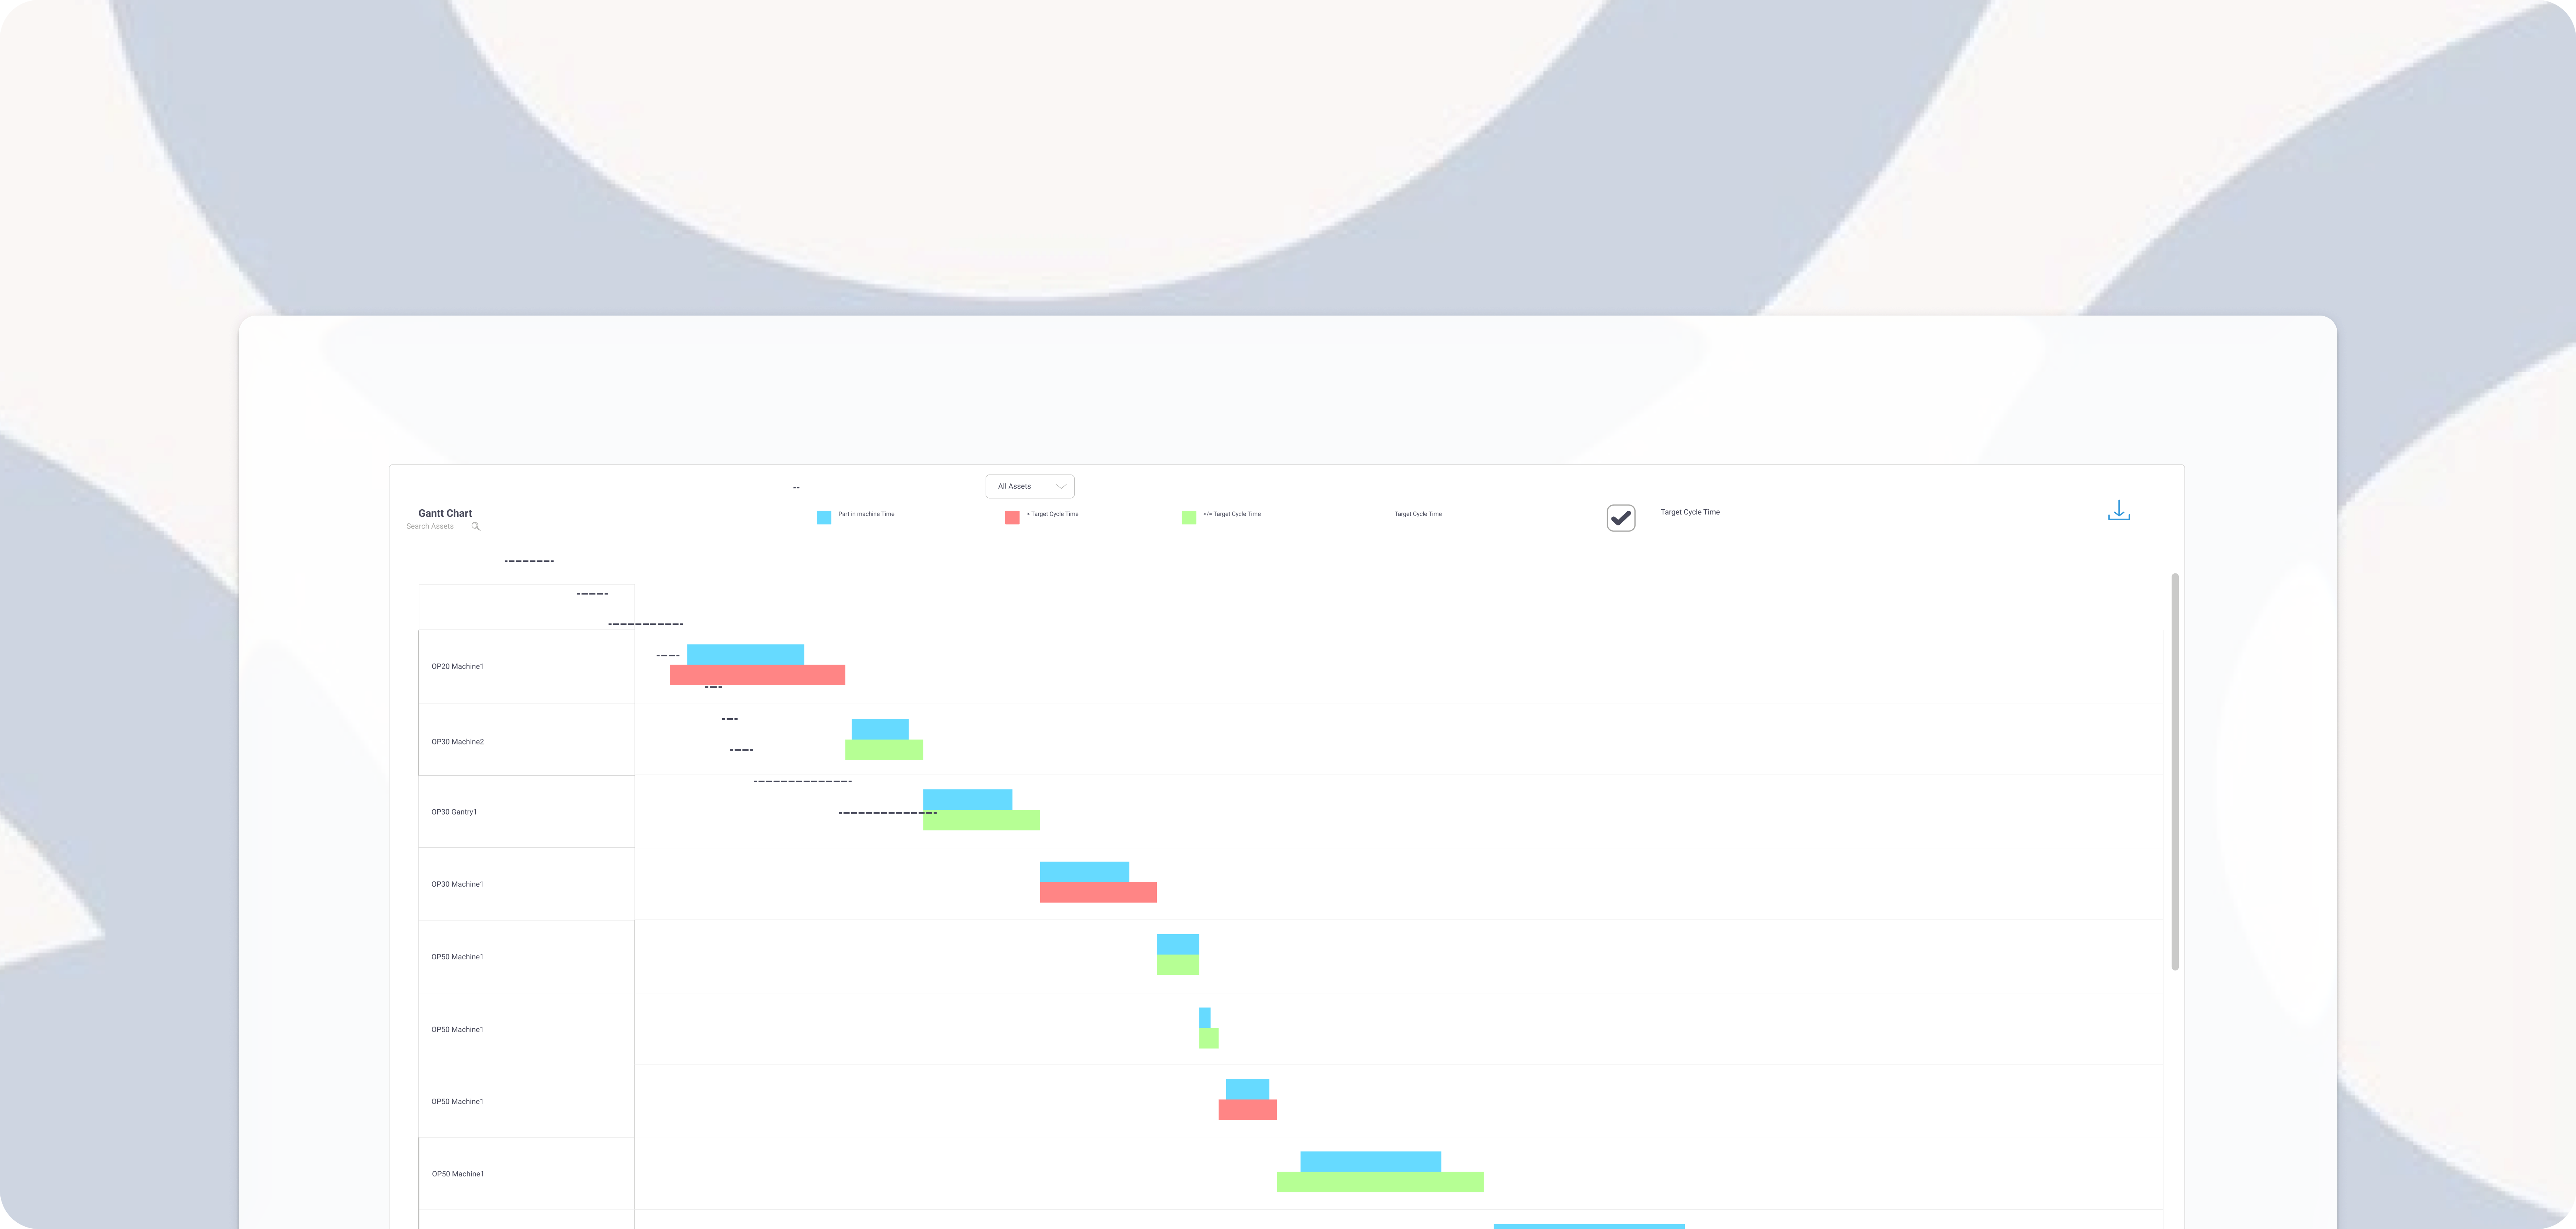

Trace the exact lifecycle of a specific part throughout the entire production line. Track all associated quality parameters and environmental conditions at the exact moment the part was processed.

View your line metrics and KPIs in a single glance. Customize views for operators, plant managers, and executives so everyone sees the data that matters most to their targets.
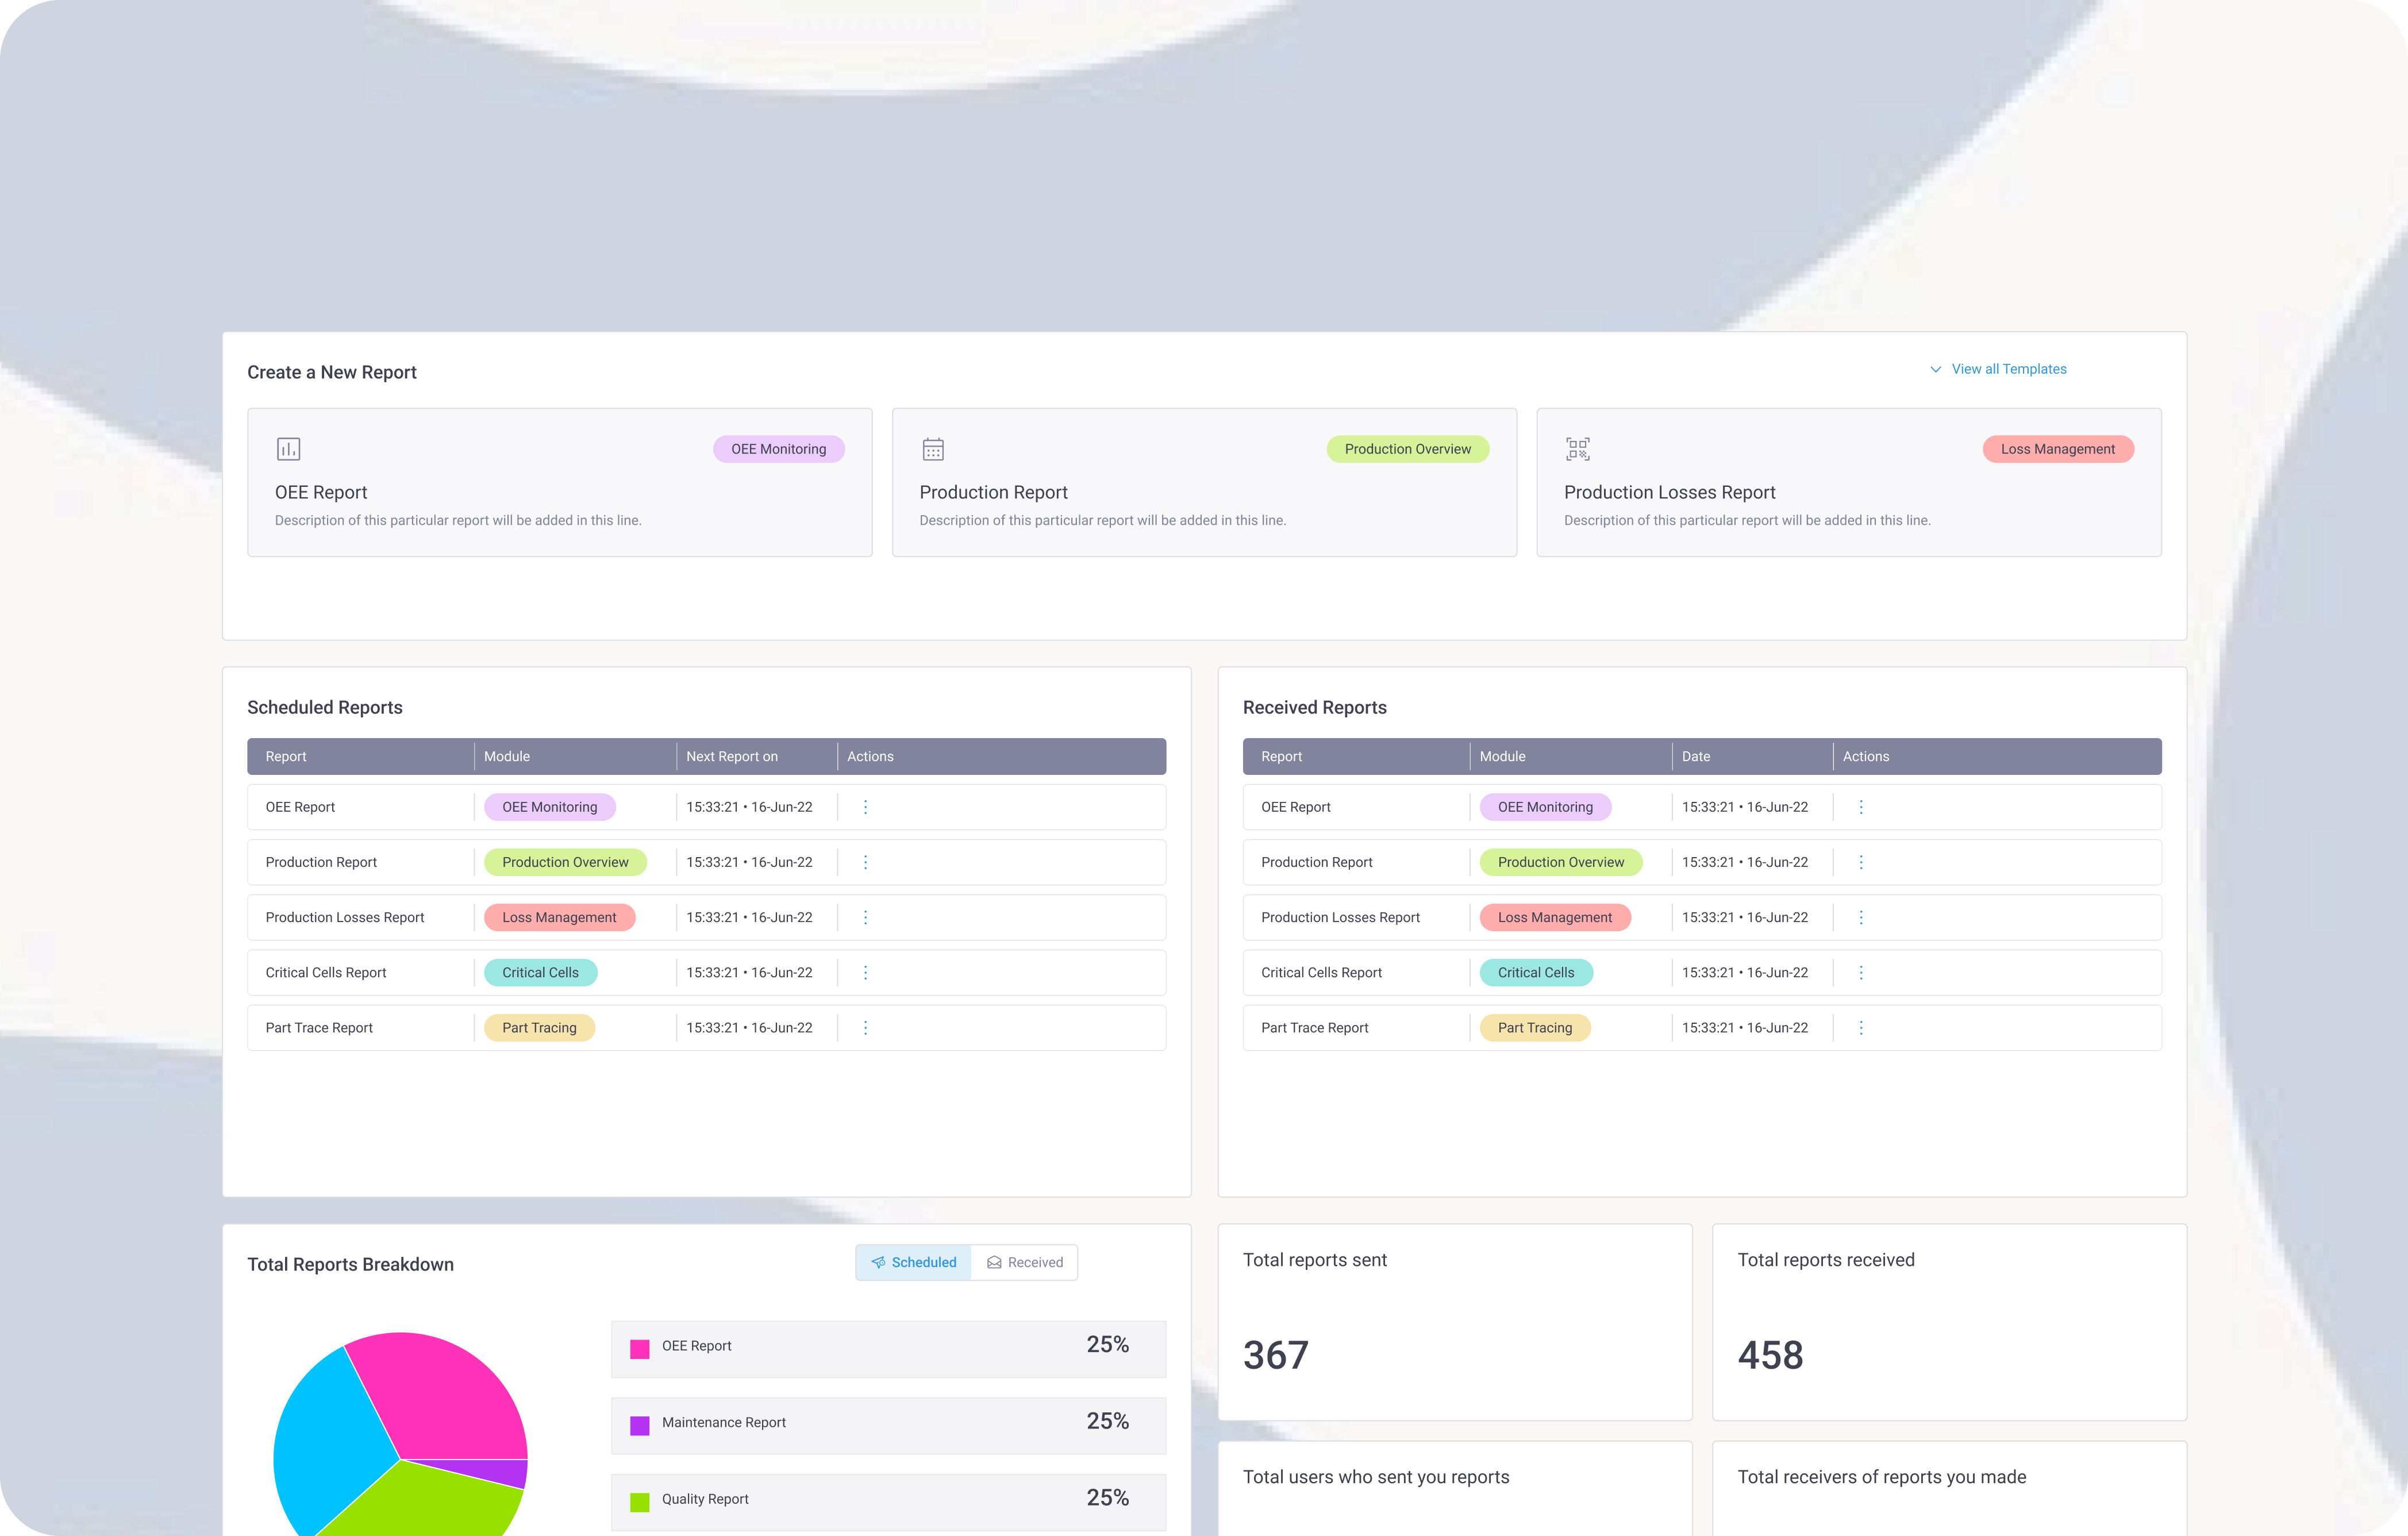
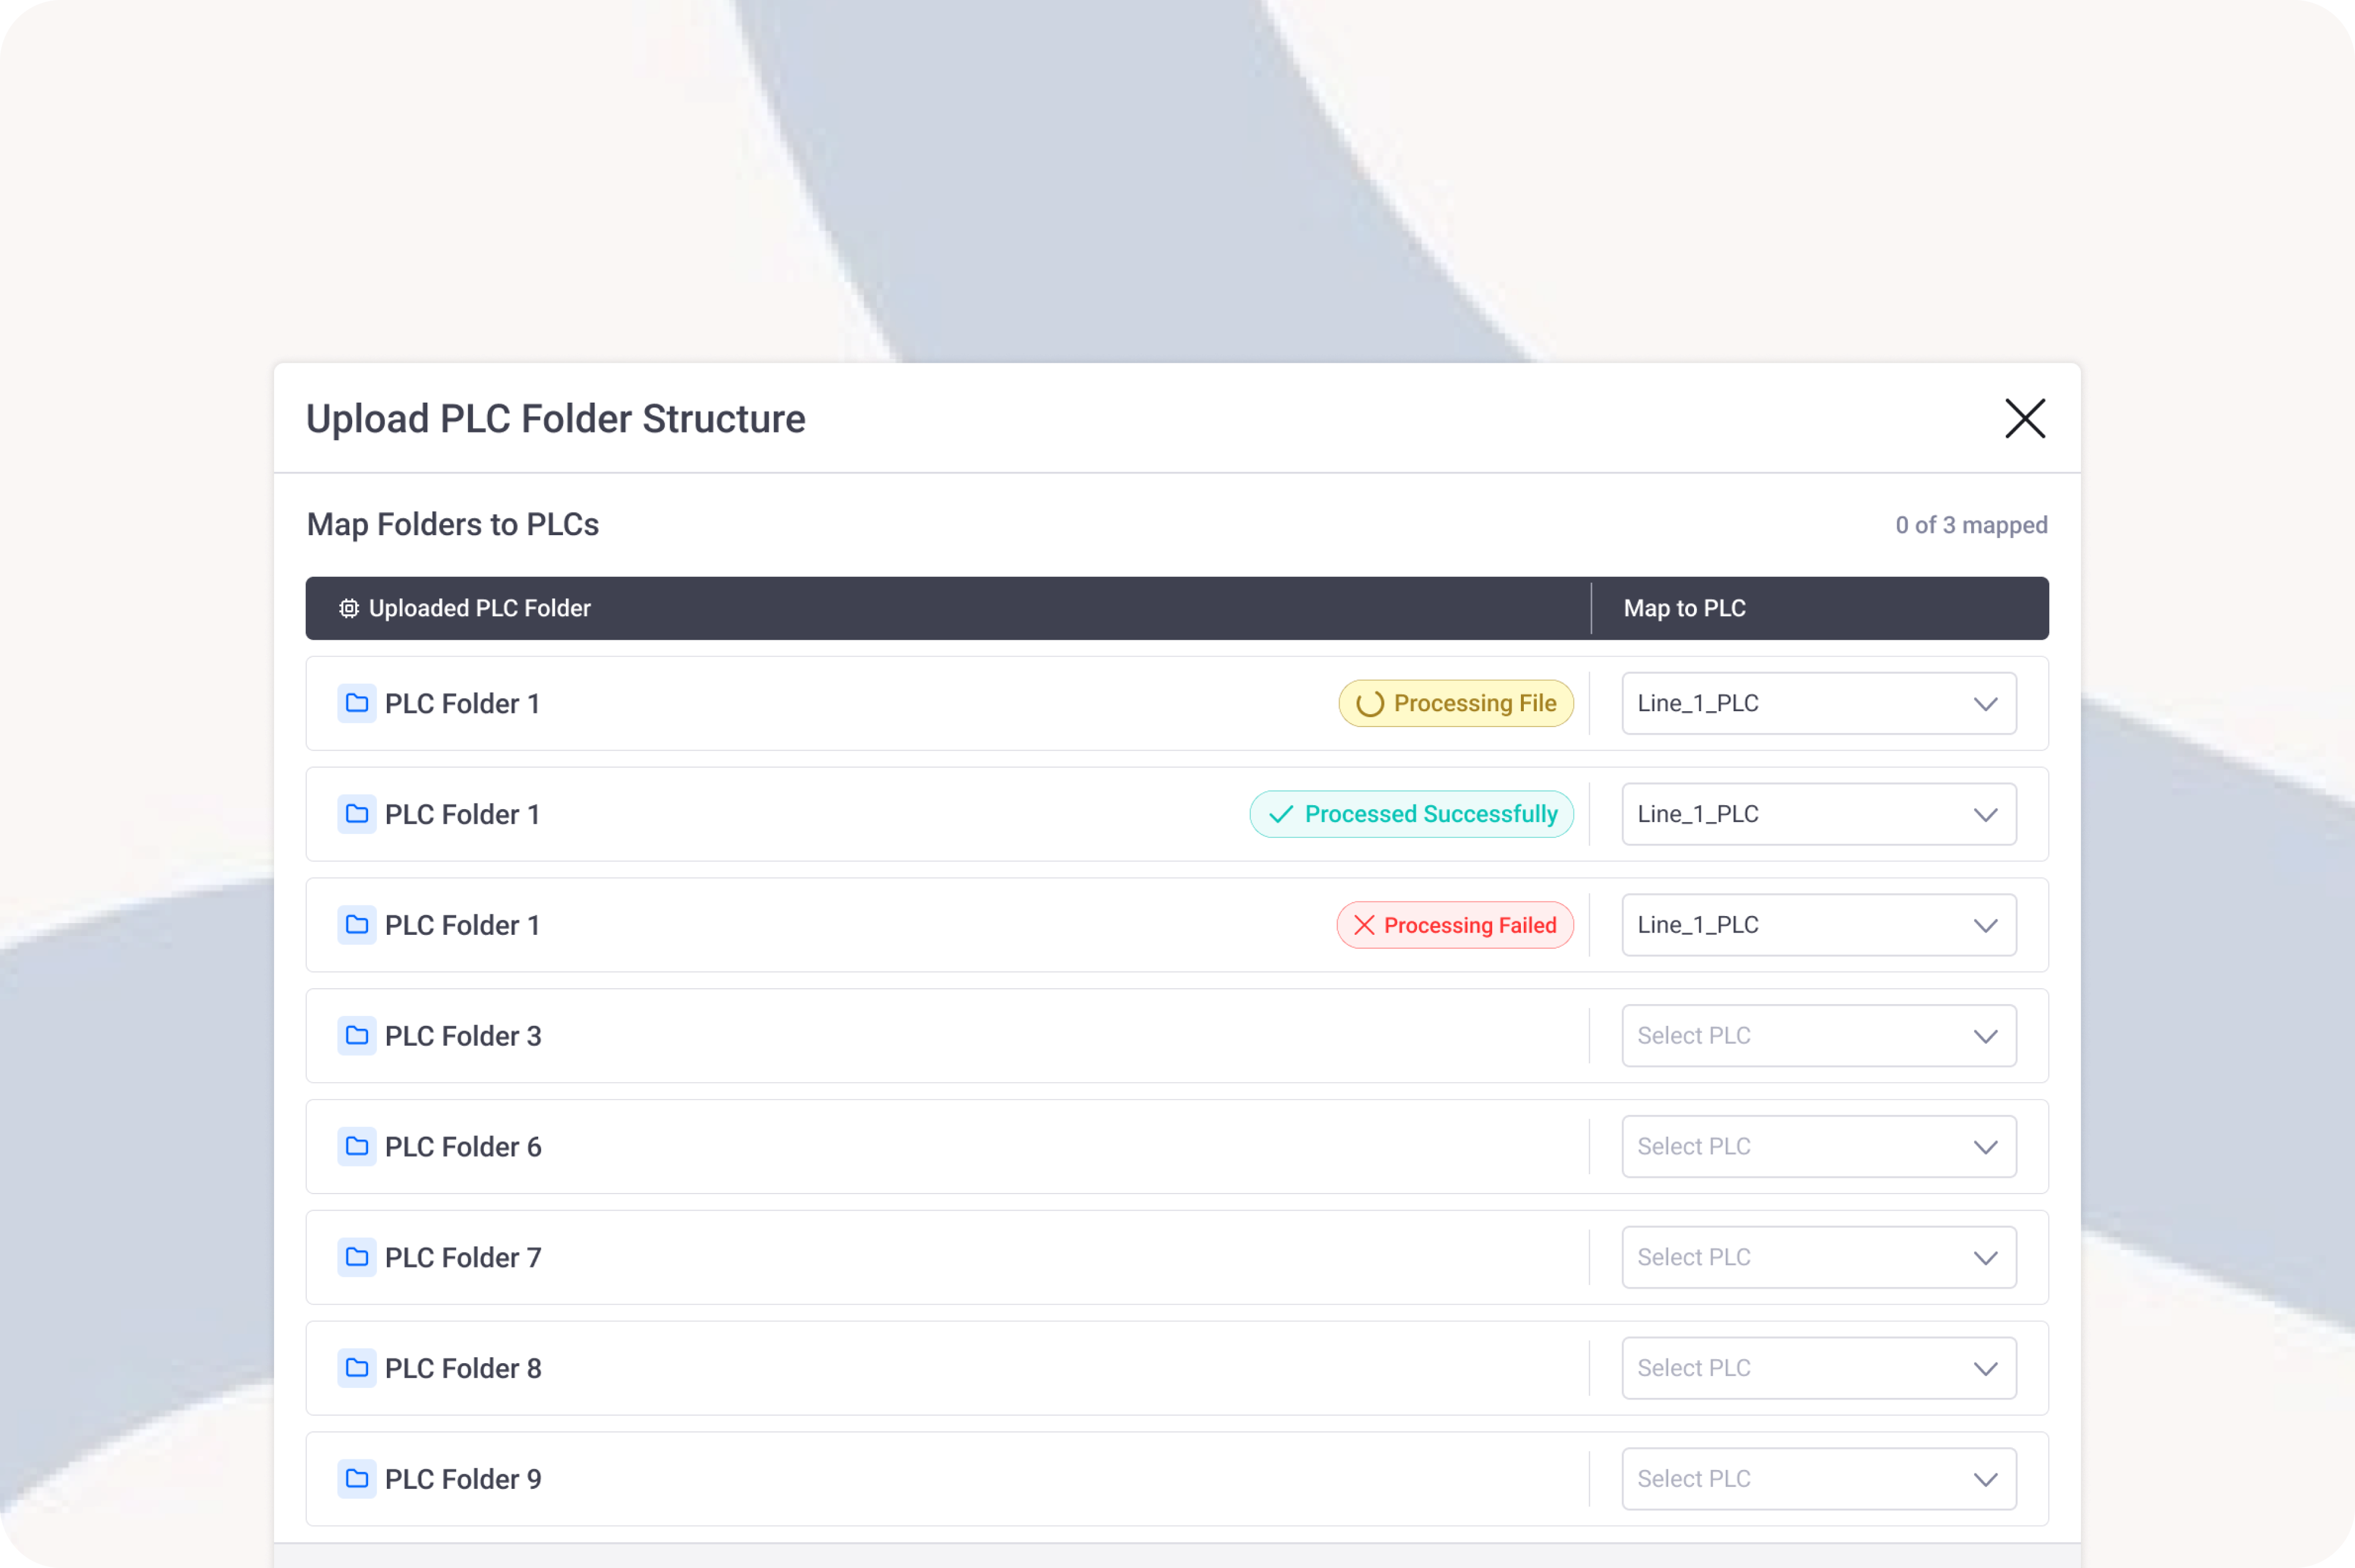
Model, formulate, and map your raw PLC tags to our standardized semantic data ontologies in minutes using a visual interface. No custom ladder logic or edge-code required.
Five simple phases that take you from raw machine signals to automated, floor-wide optimization.
An Industrial PC or edge device is deployed at your site. It securely bridges your floor without modifying a single line of existing PLC logic or risking ongoing production interference.
High-frequency data is silently collected via secure, industry-standard protocols and instantly piped to your choice of an on-premise server or our protected cloud stack.
Aggregated raw parameters are fed directly into the productivity suite to build and train a machine learning-based model mapped uniquely to your physical line dynamics.
Once modeled, performance metrics and KPIs are tracked and analyzed in real time via a fast, user-friendly dashboard canvas built for clear situational awareness.
Proprietary algorithms continually evaluate data trends to generate actionable suggestions and recommendations, stopping micro-faults before they snowball into hard downtime.